通过 GOGC 和 GOMEMLIMIT 手动控制内存
在使用 Golang 进行开发时,我们通常不会过多关注内存管理,因为 Golang 的运行时会高效地处理垃圾回收(GC)。然而,了解 GC 对性能优化场景大有裨益。本文将通过一个 XML 解析服务示例,探讨如何使用 go trace 优化 GC 并提高代码性能。
如果您对 go trace 不熟悉,可以先看下 Vincent 关于 trace 软件包的文章。
我们的目标是创建一个程序,处理多个 RSS XML 文件,并搜索标题中包含关键字 go 的项目。我们将以 RSS XML 文件为例,解析该文件 100 次,以模拟压力。
单线程方法
使用单个程序计算关键词
1 | func freq(docs []string) int { |
代码非常简单,我们使用 for 循环来完成任务,然后执行它:
1 | ➜ go_trace git:(main) ✗ go build |
然后,我们使用 go trace 查看 trace_single.out。
- RunTime: 2031ms
- STW (Stop-the-World): 57ms
- GC Occurrences: 252ms
- GC STW AVE: 0.227ms
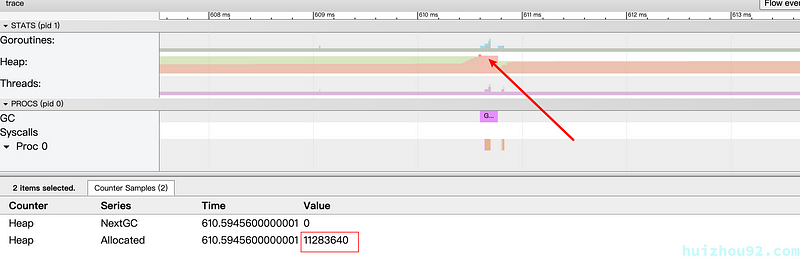
GC 时间约占总运行时间的 57 / 2031 ≈ 0.02。最大内存使用量约为 11.28MB。
图 1:单线程 - 运行时间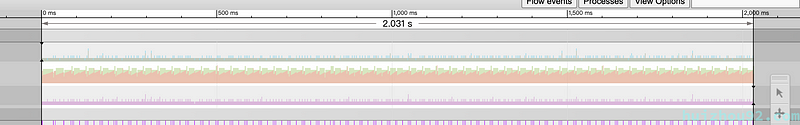
图 2:单线程 - GC
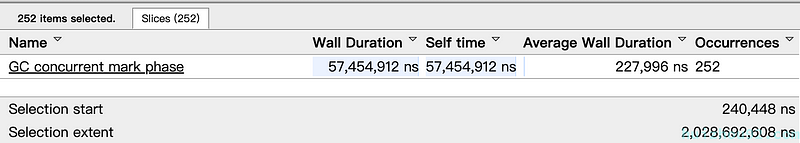
图 3:单线程 - 最大堆
目前,我们只使用了一个内核,导致资源利用率很低。为了加快程序运行速度,最好使用 Golang 最擅长的并发功能。
并行方法
使用 FinOut 计数关键词
1 | func concurrent(docs []string) int { |
用同样的方法运行程序:
1 | go build |
- RunTime: 425ms
- STW: 154ms
- GC Occurrences: 39
- GC STW AVE: 3.9ms
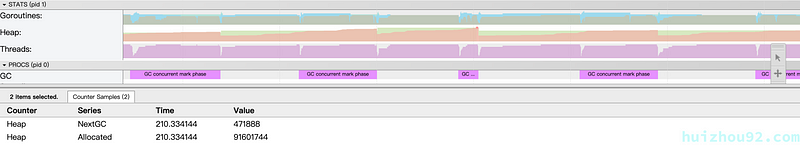
GC 时间约占总运行时间的 154 / 425 ≈ 0.36。最大内存使用量为 91.60MB。
图 4:并发 - GC 计数
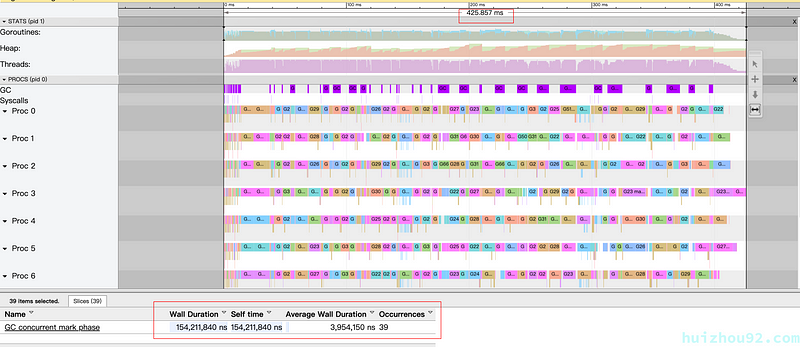
图 5:并发 - 最大堆
并发版本比单线程版本快约 5 倍。在 go 跟踪结果中,我们可以看到并发版本的 GC 占用了 36% 的运行时间。有办法优化这段时间吗?从 Go 1.19 开始,我们有两个参数可以控制 GC。
GOGC 和 GOMEMLIMIT
在 Go 1.19 中,增加了两个控制 GC 的参数。GOGC 控制垃圾回收的频率,而 GOMEMLIMIT 则限制程序的最大内存使用量。有关 GOGC 和 GOMEMLIMIT 的详细信息,请参阅官方文档 gc-guide。
GOGC
根据官方文档,计算公式如下:

理论上,如果我们将 GOGC 设置为 1000,那么 GC 的频率将降低 10 倍,而内存使用量则会增加 10 倍(这只是理论模型,实际情况更为复杂)。让我们试一试。
1 | ➜ go_trace git:(main) ✗ time GOGC=1000 ./go_trace 2 > trace_gogc_1000.out |
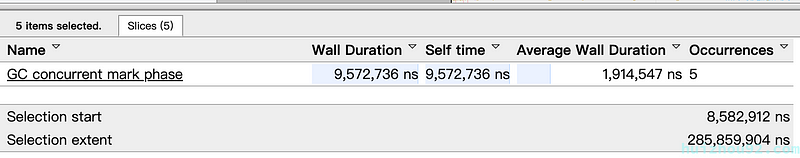
- RunTime: 314ms
- STW: 9.572ms
- GC Occurrences: 5
- GC STW AVE: 1.194ms
GC 时间约占总运行时间的 9.572 / 314 ≈ 0.02。最大内存使用量为 451MB。
图 6:GOGC - 最大堆
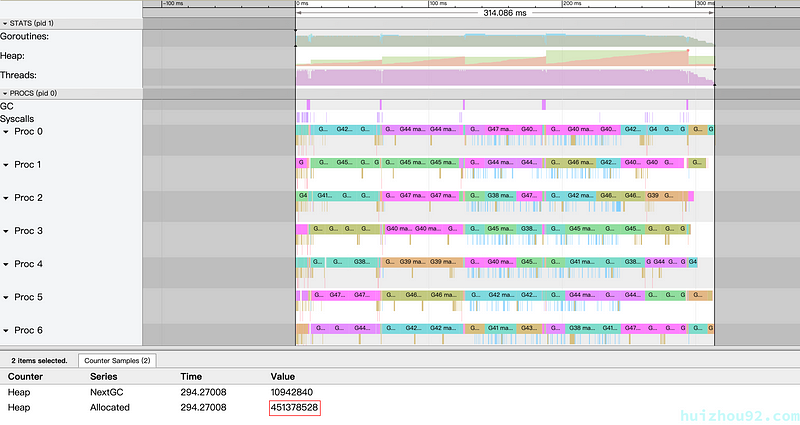
图 7:GOGC - GC 计数
GOMEMLIMIT
GOMEMLIMIT 用于设置程序的内存使用上限。它通常用于禁用自动 GC 时,允许我们手动管理总的内存使用量。当分配的内存达到上限时,将触发 GC。请注意,即使 GC 努力工作,内存使用量仍有可能超过 GOMEMLIMIT。
在单线程版本中,我们的程序使用了 11.28MB 内存。在并发版本中,有 10 个 goroutines 同时运行。根据 gc-guide 的规定,我们必须保留 10%的内存以备不时之需。因此,我们可以将 GOMEMLIMIT 设置为 11.28MB * 1.1 ≈ 124MB。
1 | ➜ go_trace git:(main) ✗ time GOGC=off GOMEMLIMIT=124MiB ./go_trace 2 > trace_mem_limit.out |
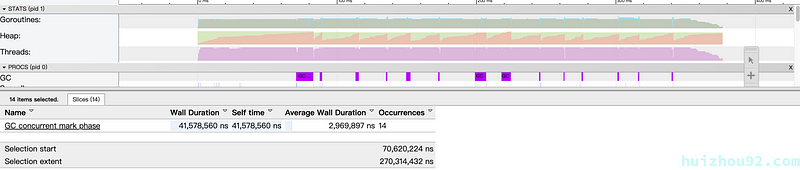
- RunTime: 376.455ms
- STW: 41.578ms
- GC Occurrences: 14
- GC STW AVE: 2.969ms
GC 时间约占总运行时间的 41.578 / 376.455 ≈ 0.11。最大内存使用量为 120MB,接近我们设定的上限。
图 8:GOMEMLIMIT - GC 最大堆
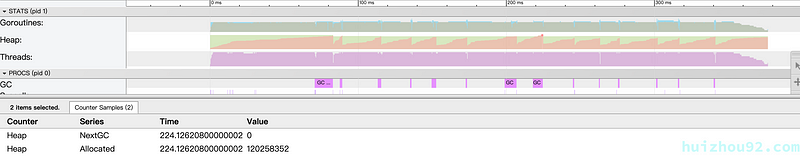
图 9:GOMEMLIMIT - GC 计数
如下图所示,增加 GOMEMLIMIT 参数可以获得更好的结果,例如 GOMEMLIMIT=248MiB 时。
图 10:GOMEMLIMIT=248MiB - GC
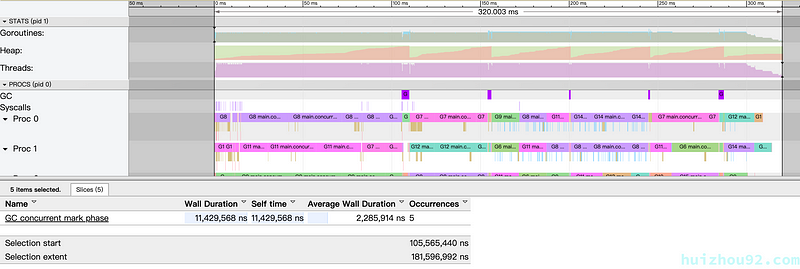
- RunTime: 320.455ms
- STW: 11.429ms
- GC Occurrences: 5
- GC STW AVE: 2.285ms
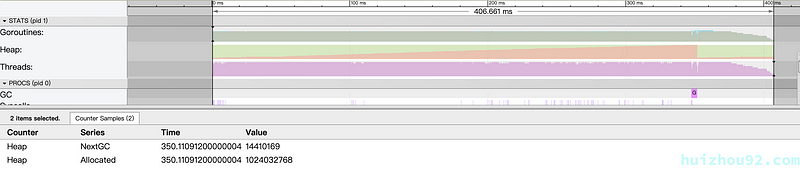
不过,它也并非没有限制。例如,在 GOMEMLIMIT=1024MiB 时,RunTime 已达到 406ms。
图 11:GOMEMLIMIT=1024MiB - GC
存在风险
官方文档的 建议用途 部分提供了明确的建议。除非熟悉程序的运行环境和工作量,否则请勿使用这两个参数。请务必阅读 gc 指南。
总结
让我们来总结一下优化过程和结果:
图 12:结果比较

在适当的情况下使用 GOGC 和 GOMEMLIMIT 可以有效提高性能。它提供了一种对不确定方面的控制感。不过,必须在受控环境中谨慎使用,以确保性能和可靠性。在资源共享或不受控的环境中应谨慎使用,以避免因设置不当而导致性能下降或程序崩溃。