2022-1-20 01:5:30 Author: www.sentinelone.com(查看原文) 阅读量:22 收藏
Endpoint Detection and Response (EDR) provides increased visibility and the data necessary for incident response, detection of threats, threat hunting, and investigations. As Endpoint Detection and Response (EDR) evolves to become Extended Detection and Response (XDR), the amount and types of data will only increase. Adding more data should not require more people to make sense of it. With the SentinelOne acquisition of Scalyr last year, we acquired a rich set of data analytics capabilities that we are bringing to our customers to make it faster and easier to make sense of all that data.
SentinelOne is pleased to announce advanced query capabilities from within the Singularity XDR platform that will change how our users can ask complex data questions and get back answers quickly.

Introducing PowerQuery for Singularity XDR
The SentinelOne PowerQuery interface provides a rich set of commands for summarizing, transforming, and manipulating data. You can filter data, perform computations, create groups and statistical summaries to answer complex questions.
PowerQuery allows you not just to search data, but to get powerful summaries of your data without the limits of having to dig through thousands of events manually. As customers onboard new 3rd-party data via the Singularity Marketplace, PowerQuery will enable them to join data across telemetry sources beyond EDR.
PowerQuery can be very useful when you want to:
- Group data (Sort, Count, etc.)
- Use Statistics as part of the query to find anomalies or start a hunt
- Look for specific things across the environment and get back a summary (IOCs)
- Have the flexibility to join or union two or more queries together to find the needle in the haystack faster
Key Capabilities
- Autocomplete makes it fast and effortless to build queries without understanding the schema
- Save and export queries via the UI or API
- Simple data summaries make finding threats and answering questions easier and faster
- Perform statistical functions on the data such as numeric, string, time
- Data aggregation (sum, count, avg, median, min, max, percentile, etc.)
- Support for RegEx in queries (matches)
- Query support for arithmetic operators (+, -, *, /, %, and negation), comparison operators (<, <=, >, >=, ==, !=), Boolean operators (Boolean operators: !, &&, ||, AND, OR, NOT)
- Ternary operators to perform complex logic (let SLA_Status = (latency > 3000 OR error_percentage > .2 ) ? “violation” : “ok”)
PowerQuery Commands include:
- Filter: Support any standard data query with autocomplete to make it simple.
- Columns: Define which columns you want in the summary table
- Group by Functions: Aggregates records, grouping them by one or more fields and computing aggregate statistics for each group and supports functions like (sum, count, estimate_distinct, percentile, min, max
- Join: Execute two or more subqueries and merge the results into a single table. Only the data from the records that match the query will be included in the results.
- Limit: Cap the number of records displayed or processed by subsequent commands
- Sort: Determine the order in which records are displayed
- Filter: Discards records that do not match a specific condition
- Transpose: Remove columns from a table and create a new column from its values
- Parse: Use regex to extract columns inline.
- Union: Executes two or more subqueries and merges the results into a single table
- Let: Defines one or more new fields in the table
There are many use cases for PowerQuery, but to help you understand the tool’s power, we have identified some examples to demonstrate how you can build queries to provide exportable and straightforward summaries of large amounts of data.
Example 1: Conti Ransomware IOC Hunt
A traditional ransomware search may require a simple query for a file hash; this is effective if you only have a few examples or matches in your environment. If the problem is more widespread, you could get back thousands of rows of data. With PowerQuery, you can quickly summarize all the hosts where you have seen this hash with additional details all from a single query. The question is, “show me a list of all the machines where we have seen this Conti hash” – this can quickly be answered with a PowerQuery.
In this PowerQuery example, we start with a simple search for a hash, but then add additional functions to group by endpoint name, add other columns to the table for source process display name and count and then sort by largest number to smallest.

- Line 1: Search for a specific SHA hash
- Line 2: Group by event count for each endpoint and source process
- Line 3: add columns to the table for endpoint name, source process display name, and count
- Line 4: Sort by largest to the smallest number of events
This query gives back an easy-to-read and understandable summary of potentially millions of records across a broad time range.
Example 2: Network Connection Volume by User and Endpoint
As part of threat hunting or an investigation, it may be helpful to determine hosts that have large amounts of connections on the network. With PowerQuery, you can do statistical calculations to build a table of endpoints and users making a high number of connections.
In this example, we start with a standard query for a process user.

Just to walk through this query line by line:
- Line 1: Simple wildcard search for source process user
- Line 2: Creating a group called connection_count, the sum of the src.process.netConnCount field by process user and endpoint name
- Line 3: Add additional columns to the table for endpoint and user
- Line 4: Sort connection_count from largest to smallest
- Line 5: Limit the results to the top 25
We provide auto-complete to make it easy to understand available fields and what you might want to do next.
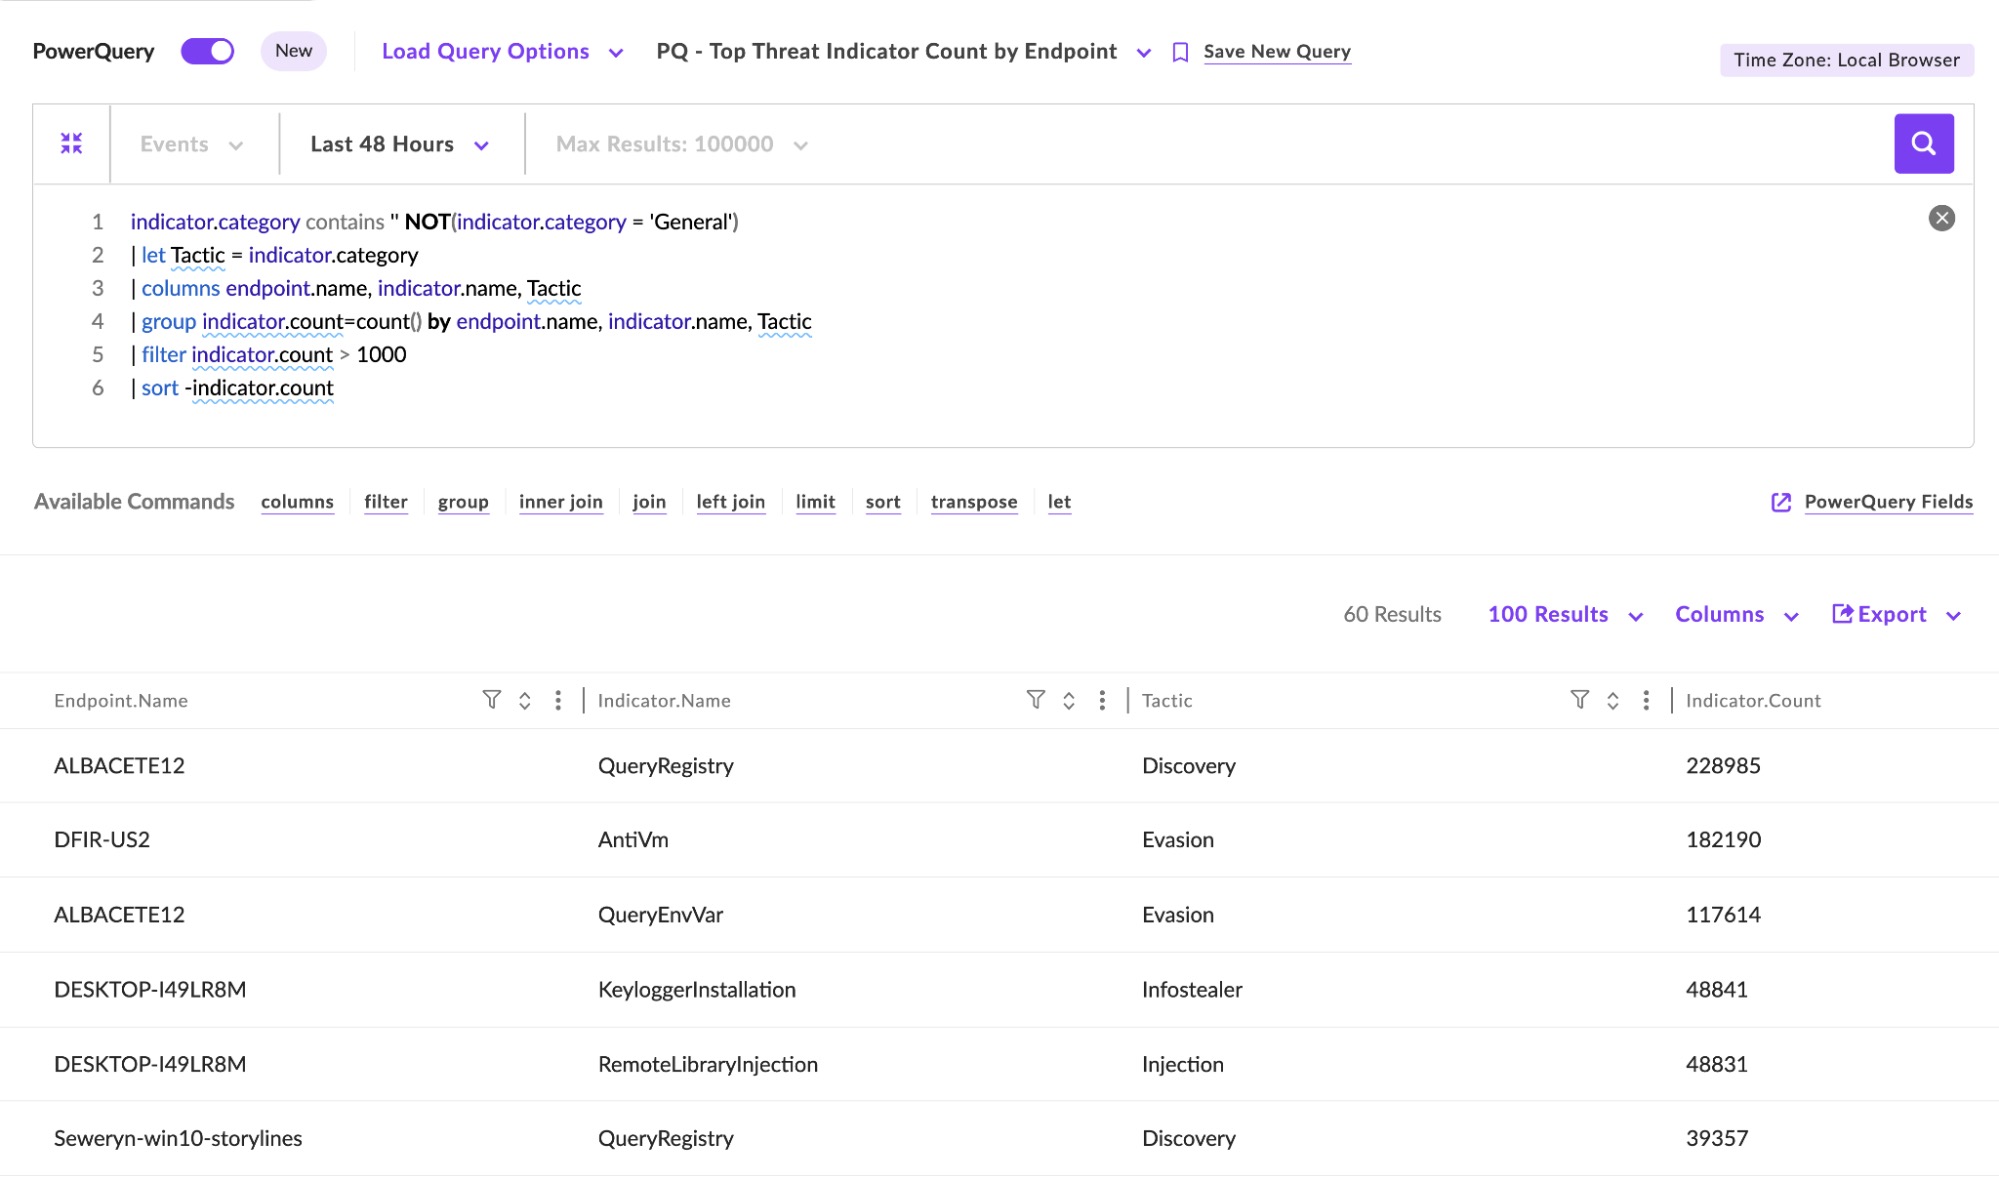
Example 3: Top Threat Indicators by Endpoint
Threat indicators can be valuable data sources for threat hunting and investigations on a host. Many threat indicators are data points that don’t always turn into threat detections. Using PowerQuery, it may be possible to identify hosts with a significant number of threat indicators to potentially identify the early stages of an attack or a breached host.
In this example, we will build a hosts table with large numbers of threat indicators.

To answer this question with a PowerQuery, we just need a few additional transformations:
- Line 1: Search for any records that have relevant indicator categories, not “General”
- Line 2: Create a new column named Tactic, which is equal to the indicator.category field
- Line 3: Define columns for our table – endpoint, indicator name, and tactic
- Line 4: Group data by indicator count for each column
- Line 5: Filter data to endpoints that have more than 1000 indicators over the time period
- Line 6: Sort from largest indicator count to smallest
PowerQuery Extracts More Value From Your Data
PowerQuery is the next step towards providing the data analytics capabilities you need to unlock the full potential of your EDR and XDR data. While this blog post contains three simple examples of PowerQuery, there are many different capabilities for the tool to allow novice and advanced users to get answers from their data.
Users will have much larger limits on the number of rows in the data they are querying and won’t have to export search results to CSV for further analysis. Users can easily save these queries to come back and generate updated tables within seconds or use the API to pull this data into an external application.
If you would like to learn more about PowerQueries, Singularity XDR and the SentinelOne Data platform, contact us for more information or request a free demo.
SentinelOne Singularity XDR
Supercharge. Fortify. Automate. Extend protection with unfettered visibility, proven protection, and unparalleled response.
如有侵权请联系:admin#unsafe.sh