
Loading...


We’re excited to announce the availability of Network Analytics Logs. Magic Transit, Magic Firewall, Magic WAN, and Spectrum customers on the Enterprise plan can feed packet samples directly into storage services, network monitoring tools such as Kentik, or their Security Information Event Management (SIEM) systems such as Splunk to gain near real-time visibility into network traffic and DDoS attacks.
What’s included in the logs
By creating a Network Analytics Logs job, Cloudflare will continuously push logs of packet samples directly to the HTTP endpoint of your choice, including Websockets. The logs arrive in JSON format which makes them easy to parse, transform, and aggregate. The logs include packet samples of traffic dropped and passed by the following systems:
- Network-layer DDoS Protection Ruleset
- Advanced TCP Protection
- Magic Firewall
Note that not all mitigation systems are applicable to all Cloudflare services. Below is a table describing which mitigation service is applicable to which Cloudflare service:
Mitigation System |
Cloudflare Service | ||
|---|---|---|---|
| Magic Transit | Magic WAN | Spectrum | |
| Network-layer DDoS Protection Ruleset | ✅ | ❌ | ✅ |
| Advanced TCP Protection | ✅ | ❌ | ❌ |
| Magic Firewall | ✅ | ✅ | ❌ |
Packets are processed by the mitigation systems in the order outlined above. Therefore, a packet that passed all three systems may produce three packet samples, one from each system. This can be very insightful when troubleshooting and wanting to understand where in the stack a packet was dropped. To avoid overcounting the total passed traffic, Magic Transit users should only take into consideration the passed packets from the last mitigation system, Magic Firewall.
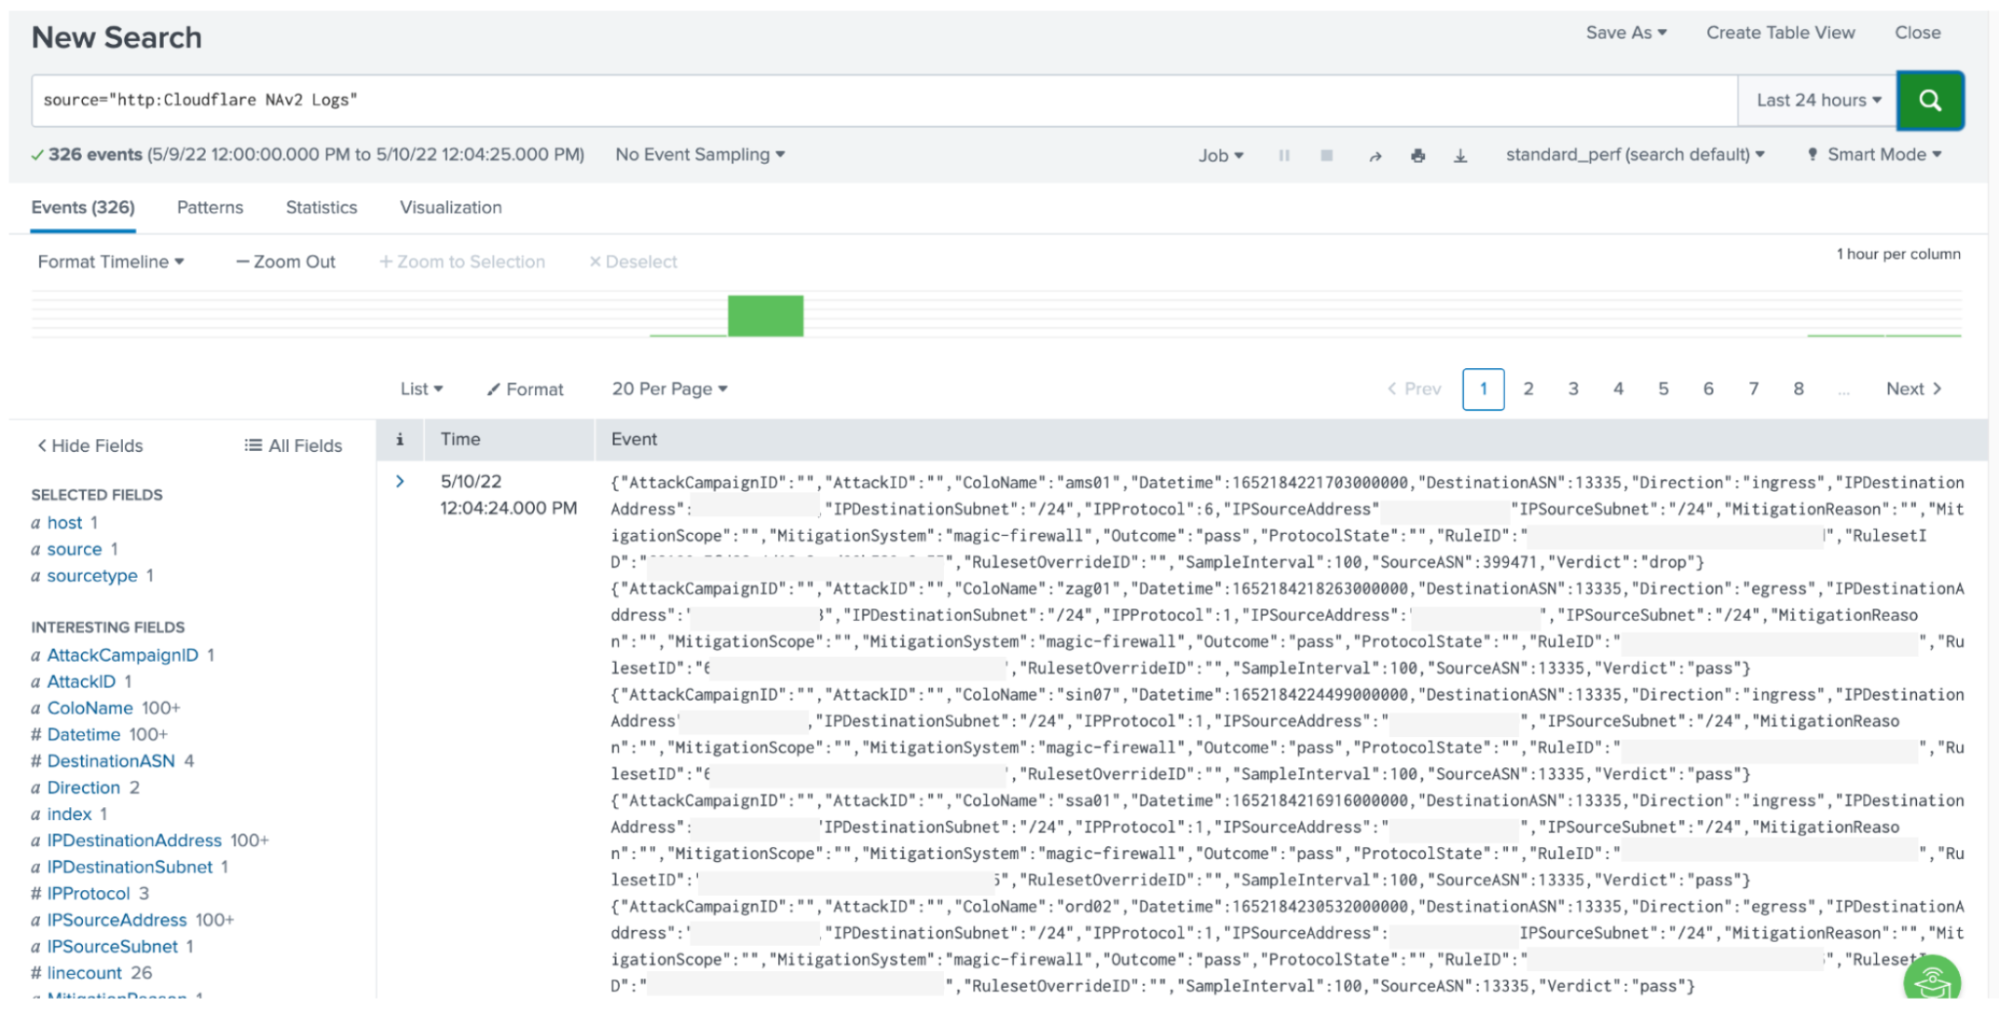
An example of a packet sample log:
{"AttackCampaignID":"","AttackID":"","ColoName":"bkk06","Datetime":1652295571783000000,"DestinationASN":13335,"Direction":"ingress","IPDestinationAddress":"(redacted)","IPDestinationSubnet":"/24","IPProtocol":17,"IPSourceAddress":"(redacted)","IPSourceSubnet":"/24","MitigationReason":"","MitigationScope":"","MitigationSystem":"magic-firewall","Outcome":"pass","ProtocolState":"","RuleID":"(redacted)","RulesetID":"(redacted)","RulesetOverrideID":"","SampleInterval":100,"SourceASN":38794,"Verdict":"drop"}
All the available log fields are documented here: https://developers.cloudflare.com/logs/reference/log-fields/account/network_analytics_logs/
Setting up the logs
In this walkthrough, we will demonstrate how to feed the Network Analytics Logs into Splunk via Postman. At this time, it is only possible to set up Network Analytics Logs via API. Setting up the logs requires three main steps:
- Create a Cloudflare API token.
- Create a Splunk Cloud HTTP Event Collector (HEC) token.
- Create and enable a Cloudflare Logpush job.
Let’s get started!
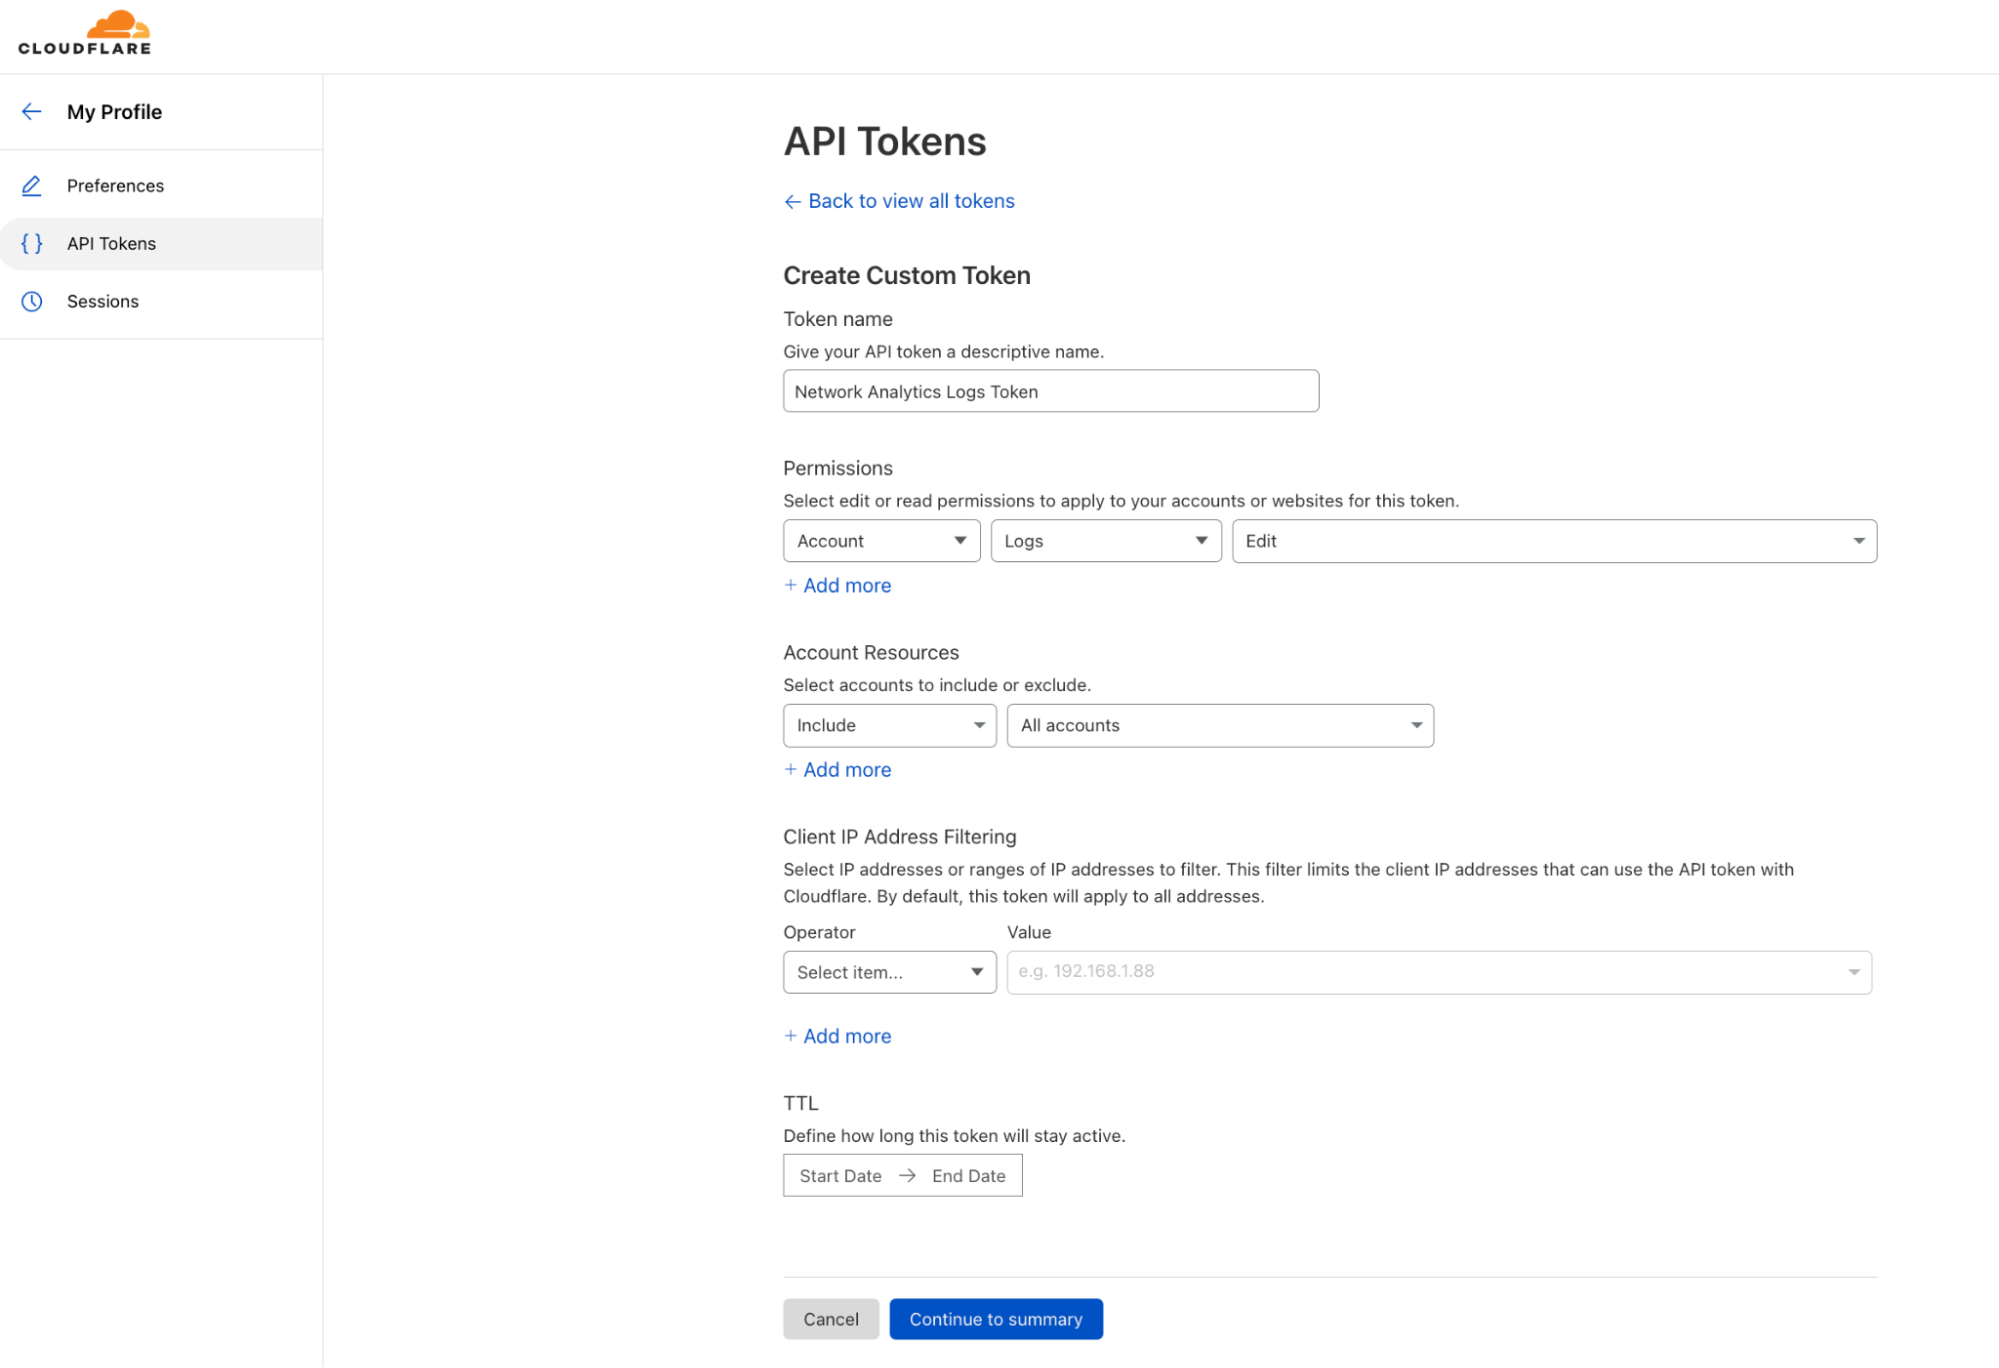
1) Create a Cloudflare API token
- Log in to your Cloudflare account and navigate to My Profile.
- On the left-hand side, in the collapsing navigation menu, click API Tokens.
- Click Create Token and then, under Custom token, click Get started.
- Give your custom token a name, and select an Account scoped permission to edit Logs. You can also scope it to a specific/subset/all of your accounts.
- At the bottom, click Continue to summary, and then Create Token.
- Copy and save your token. You can also test your token with the provided snippet in Terminal.
When you're using an API token, you don't need to provide your email address as part of the API credentials.
Read more about creating an API token on the Cloudflare Developers website: https://developers.cloudflare.com/api/tokens/create/
2) Create a Splunk token for an HTTP Event Collector
In this walkthrough, we’re using a Splunk Cloud free trial, but you can use almost any service that can accept logs over HTTPS. In some cases, if you’re using an on-premise SIEM solution, you may need to allowlist Cloudflare IP address in your firewall to be able to receive the logs.
- Create a Splunk Cloud account. I created a trial account for the purpose of this blog.
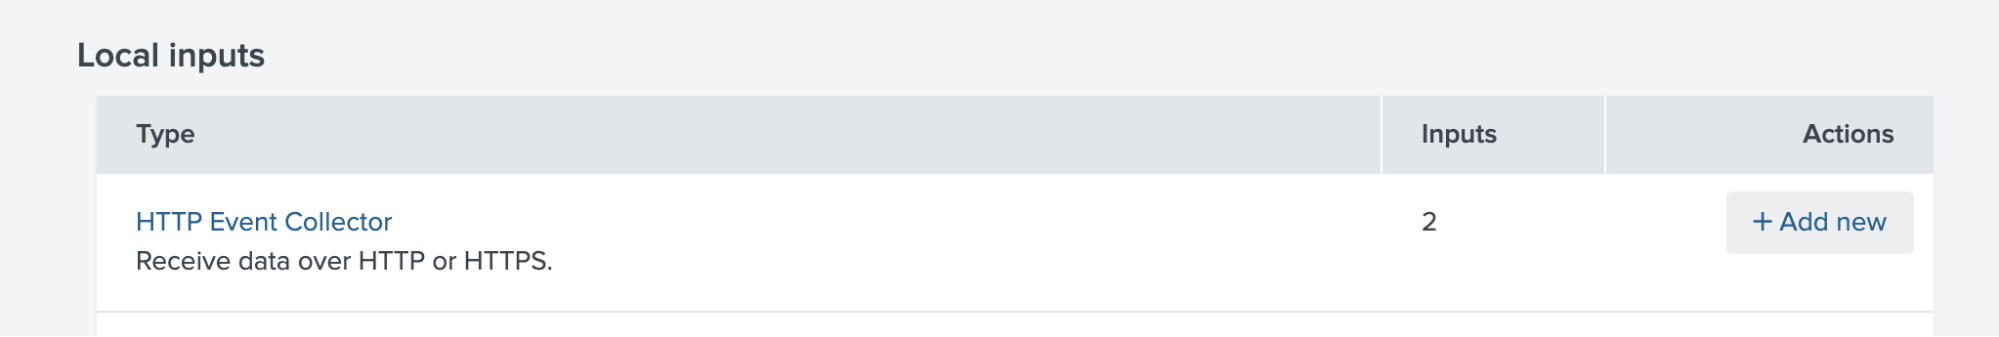
- In the Splunk Cloud dashboard, go to Settings > Data Input.
- Next to HTTP Event Collector, click Add new.
- Follow the steps to create a token.
- Copy your token and your allocated Splunk hostname and save both for later.
Read more about using Splunk with Cloudflare Logpush on the Cloudflare Developers website: https://developers.cloudflare.com/logs/get-started/enable-destinations/splunk/
Read more about creating an HTTP Event Collector token on Splunk’s website: https://docs.splunk.com/Documentation/Splunk/8.2.6/Data/UsetheHTTPEventCollector
3) Create a Cloudflare Logpush job
Creating and enabling a job is very straightforward. It requires only one API call to Cloudflare to create and enable a job.
To send the API calls I used Postman, which is a user-friendly API client that was recommended to me by a colleague. It allows you to save and customize API calls. You can also use Terminal/CMD or any other API client/script of your choice.
One thing to notice is Network Analytics Logs are account-scoped. The API endpoint is therefore a tad different from what you would normally use for zone-scoped datasets such as HTTP request logs and DNS logs.
This is the endpoint for creating an account-scoped Logpush job:
https://api.cloudflare.com/client/v4/accounts/{account-id}/logpush/jobs
Your account identifier number is a unique identifier of your account. It is a string of 32 numbers and characters. If you’re not sure what your account identifier is, log in to Cloudflare, select the appropriate account, and copy the string at the end of the URL.
https://dash.cloudflare.com/{account-id}
Then, set up a new request in Postman (or any other API client/CLI tool).
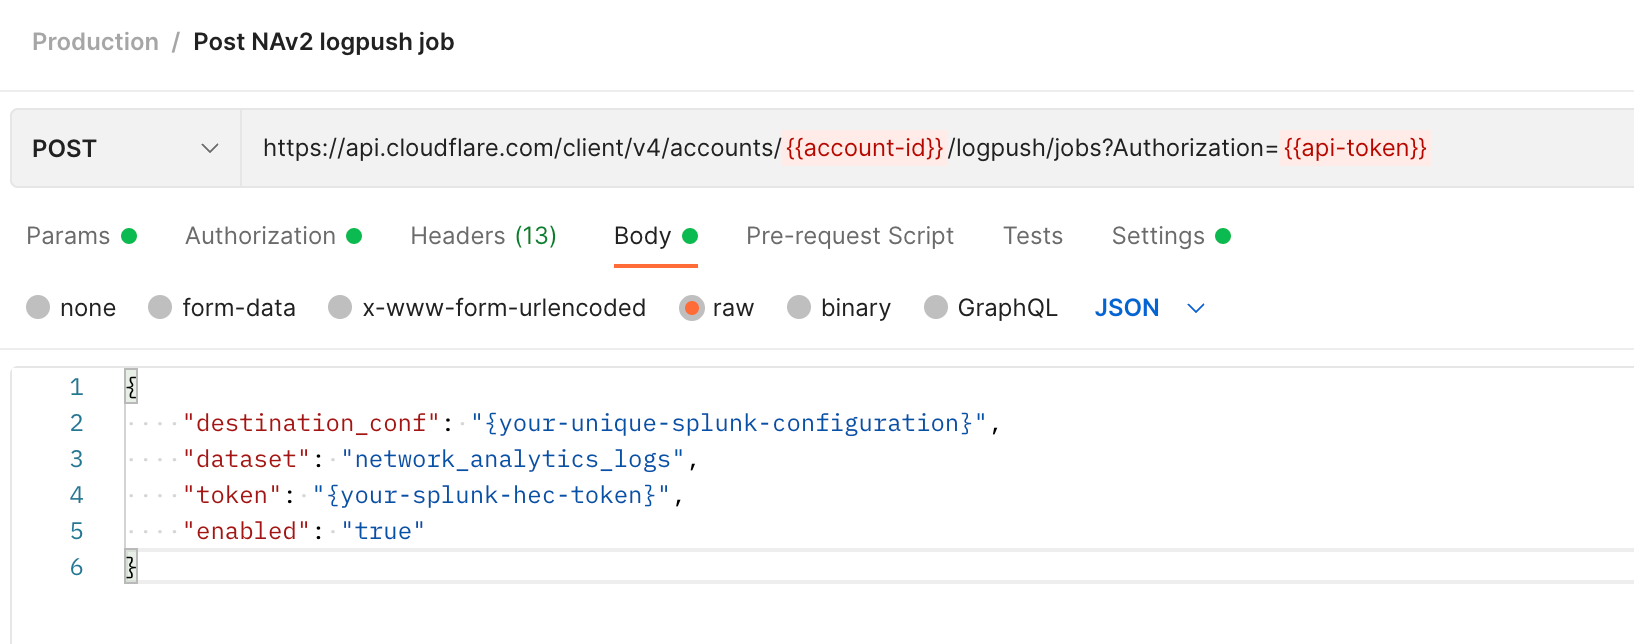
To successfully create a Logpush job, you’ll need the HTTP method, URL, Authorization token, and request body (data). The request body must include a destination configuration (destination_conf), the specified dataset (network_analytics_logs, in our case), and the token (your Splunk token).
Method:
POST
URL:
https://api.cloudflare.com/client/v4/accounts/{account-id}/logpush/jobs
Authorization: Define a Bearer authorization in the Authorization tab, or add it to the header, and add your Cloudflare API token.
Body: Select a Raw > JSON
{
"destination_conf": "{your-unique-splunk-configuration}",
"dataset": "network_analytics_logs",
"token": "{your-splunk-hec-tag}",
"enabled": "true"
}
If you’re using Splunk Cloud, then your unique configuration has the following format:
{your-unique-splunk-configuration}=splunk://{your-splunk-hostname}.splunkcloud.com:8088/services/collector/raw?channel={channel-id}&header_Authorization=Splunk%20{your-splunk–hec-token}&insecure-skip-verify=false
Definition of the variables:
{your-splunk-hostname}= Your allocated Splunk Cloud hostname.
{channel-id} = A unique ID that you choose to assign for.`{your-splunk–hec-token}` = The token that you generated for your Splunk HEC.
An important note is that customers should have a valid SSL/TLS certificate on their Splunk instance to support an encrypted connection.
After you’ve done that, you can create a GET request to the same URL (no request body needed) to verify that the job was created and is enabled.
The response should be similar to the following:
{
    "errors": [],
    "messages": [],
    "result": {
        "id": {job-id},
        "dataset": "network_analytics_logs",
        "frequency": "high",
        "kind": "",
        "enabled": true,
        "name": null,
        "logpull_options": null,
        "destination_conf": "{your-unique-splunk-configuration}",
        "last_complete": null,
        "last_error": null,
        "error_message": null
    },
    "success": true
}
Shortly after, you should start receiving logs to your Splunk HEC.
Read more about enabling Logpush on the Cloudflare Developers website: https://developers.cloudflare.com/logs/reference/logpush-api-configuration/examples/example-logpush-curl/
Reduce costs with R2 storage
Depending on the amount of logs that you read and write, the cost of third party cloud storage can skyrocket — forcing you to decide between managing a tight budget and being able to properly investigate networking and security issues. However, we believe that you shouldn’t have to make those trade-offs. With R2’s low costs, we’re making this decision easier for our customers. Instead of feeding logs to a third party, you can reap the cost benefits of storing them in R2.
To learn more about the R2 features and pricing, check out the full blog post. To enable R2, contact your account team.
Cloudflare logs for maximum visibility
Cloudflare Enterprise customers have access to detailed logs of the metadata generated by our products. These logs are helpful for troubleshooting, identifying network and configuration adjustments, and generating reports, especially when combined with logs from other sources, such as your servers, firewalls, routers, and other appliances.
Network Analytics Logs joins Cloudflare’s family of products on Logpush: DNS logs, Firewall events, HTTP requests, NEL reports, Spectrum events, Audit logs, Gateway DNS, Gateway HTTP, and Gateway Network.
Not using Cloudflare yet? Start now with our Free and Pro plans to protect your websites against DDoS attacks, or contact us for comprehensive DDoS protection and firewall-as-a-service for your entire network.