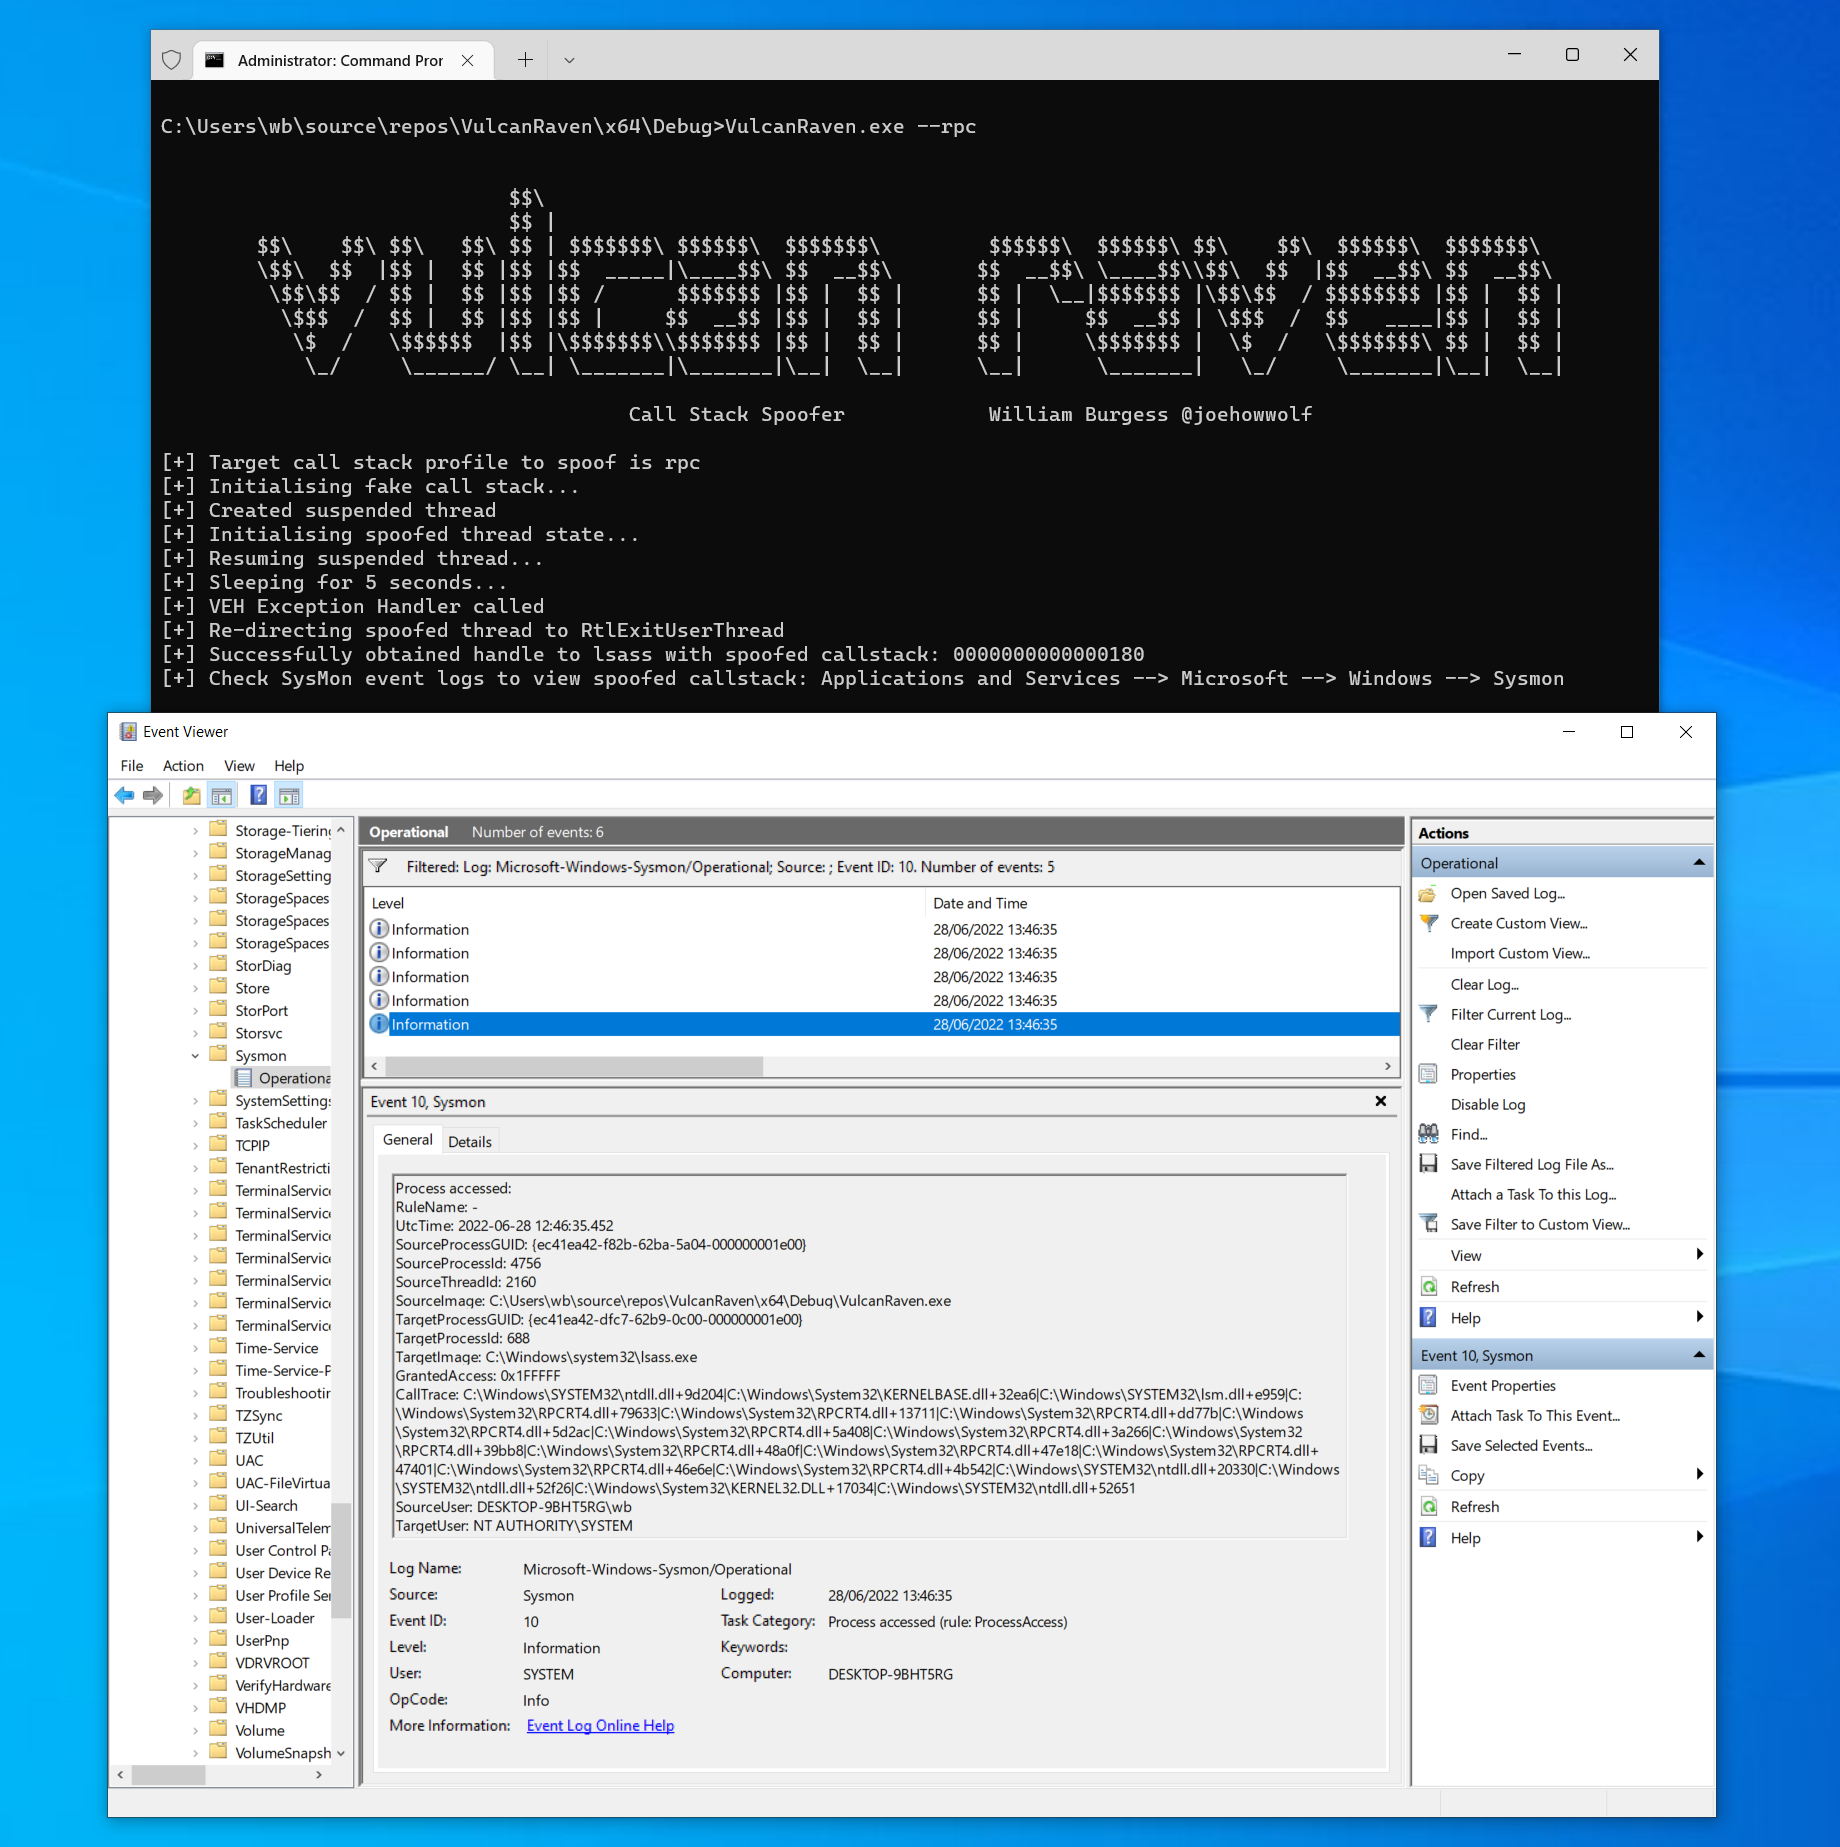
This repository demonstrates a PoC implementation to spoof arbitrary call stacks when making system calls. For a full technical walkthrough please see the accompanying blog post here: https://labs.withsecure.com/blog/spoofing-call-stacks-to-confuse-edrs.
By default it contains three sample call stacks to mimic, which can be selected via supplying either --wmi, --rpc, or --svchost, as demonstrated below:
These call stacks were obtained by running SysMon with process access events enabled and searching for events where lsass was the target of the handle operation.
NB As a word of caution, this PoC was tested on the following Windows build:
- 10.0.19044.1706 (21h2)
It has not been tested on any other versions and offsets may obviously vary (and hence break) on different Windows builds.
If you are having trouble, one technique to debug errors is to find the process generating OpenProcess events in SysMon and attach to it in
WinDbg. Once attached, run bp ntdll!NtOpenProcess and when bp is hit run knf.
This will display output similar to the below, which will contain full symbol resolution and the correct stack utilisation space (indicated by the 'Memory' column):
0:003> knf
 #   Memory  Child-SP          RetAddr               Call Site
00           00000037`f01fe300 00007ffd`221d2ea6     ntdll!NtOpenProcess+0x12
01         8 00000037`f01fe308 00007ffd`1ffee959     KERNELBASE!ProcessIdToSessionId+0x96
02        80 00000037`f01fe388 00007ffd`23b99633     lsm!RpcOpenEnum+0x129
03       430 00000037`f01fe7b8 00007ffd`23b33711     RPCRT4!Invoke+0x73
04        40 00000037`f01fe7f8 00007ffd`23bfd77b     RPCRT4!Ndr64UnmarshallHandle+0xe1
05        70 00000037`f01fe868 00007ffd`23b7d2ac     RPCRT4!Ndr64StubWorker+0xb0b
06       6c0 00000037`f01fef28 00007ffd`23b7a408     RPCRT4!NdrServerCallAll+0x3c
07        50 00000037`f01fef78 00007ffd`23b5a266     RPCRT4!DispatchToStubInCNoAvrf+0x18
08        50 00000037`f01fefc8 00007ffd`23b59bb8     RPCRT4!RPC_INTERFACE::DispatchToStubWorker+0x1a6
09        e0 00000037`f01ff0a8 00007ffd`23b68a0f     RPCRT4!RPC_INTERFACE::DispatchToStub+0xf8
0a        70 00000037`f01ff118 00007ffd`23b67e18     RPCRT4!LRPC_SCALL::DispatchRequest+0x31f
0b        d0 00000037`f01ff1e8 00007ffd`23b67401     RPCRT4!LRPC_SCALL::HandleRequest+0x7f8
0c       110 00000037`f01ff2f8 00007ffd`23b66e6e     RPCRT4!LRPC_ADDRESS::HandleRequest+0x341
0d        a0 00000037`f01ff398 00007ffd`23b6b542     RPCRT4!LRPC_ADDRESS::ProcessIO+0x89e
0e       140 00000037`f01ff4d8 00007ffd`24ab0330     RPCRT4!LrpcIoComplete+0xc2
0f        a0 00000037`f01ff578 00007ffd`24ae2f26     ntdll!TppAlpcpExecuteCallback+0x260
10        80 00000037`f01ff5f8 00007ffd`23387034     ntdll!TppWorkerThread+0x456
11       300 00000037`f01ff8f8 00007ffd`24ae2651     KERNEL32!BaseThreadInitThunk+0x14
12        30 00000037`f01ff928 00000000`00000000     ntdll!RtlUserThreadStart+0x21
As a note, the total stack space used by the current call site is indicated in the row below (e.g. ntdll!NtOpenProcess only takes up 8 bytes). As stated previously, a complete technical walkthrough is covered in the blog linked at the start of this readme which will explain this (and concepts like Child-SP) in more detail. The values generated by windbg can then be used to correlate with what is being returned by CalculateFunctionStackSize() in the event of any problems.
Thanks to the unicorn_pe project (https://github.com/hzqst/unicorn_pe) for example code in parsing UNWIND_CODEs.
