The Microsoft Edge browser makes use of a service called Microsoft Defender SmartScreen to help protect users from phishing websites and malicious downloads. The SmartScreen service integrates with a Microsoft threat intelligence service running in the cloud to quickly block discovered threats. As I explained last year, the SmartScreen service also helps reduce spurious security warnings for known-safe downloads — for example, if a setup.exe file is known safe, the browser will not warn the user that it is potentially dangerous.
Sometimes, users find that SmartScreen is behaving unexpectedly; for example, today an Edge user reported that they’re seeing the “potentially dangerous” warning for a popular installer, but no one else has been able to reproduce the warning. After quickly validating that SmartScreen is enabled in the system’s App & Browser Control > Reputation based protection settings panel:

…we asked the user to confirm that SmartScreen was generally working as expected using the SmartScreen demo page. We found that SmartScreen was generally performing as expected (by blocking the demo phishing pages), so the problem is narrower than a general failure to reach the SmartScreen service, for example.
SmartScreen Logging
At this point, we can’t make much progress without logs from the impacted client. While Telerik Fiddler is a good way to observe traffic between the Edge client and the web service, it’s not always the most convenient tool to use. Historically, SmartScreen used a platform networking stack to talk to the web service, but the team is in the process of migrating to use Edge’s own network stack for this communication. After that refactoring is completed, Edge’s Net Export feature will capture the responses from the SmartScreen service (but due to limitations in the NetLog format, the request data sent to SmartScreen won’t be in those logs).
Fortunately, there’s another logging service in Edge that we can take advantage of– the edge://tracing feature. This incredibly powerful feature allows tracing of the browser’s behavior across most of its subsystems, and it is often used for diagnosing performance problems in web content. But relevant to us here, it also allows capturing data flowing to the SmartScreen web service.
Capture a SmartScreen Trace
To capture a trace of SmartScreen, follow these steps:
- Start Microsoft Edge and navigate to edge://tracing
- Click the Record button:

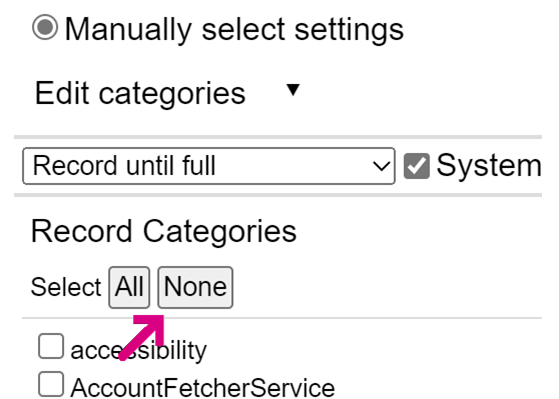
3. In the popup that appears, choose the Manually select settings radio button, then click the None button under Record categories to clear all of the checkboxes below it:

4. Scroll down the list of categories and place a checkmark next to SmartScreen

5. At the bottom of the popup, push the Record button:

6. A new popup will appear indicating that recording has started.

7. Open a new tab and perform your repro (e.g. visit the download page and start the download. Allow the download to complete).
8. In the original tab, click the Stop button on the popup. The trace will complete and a trace viewer will appear.
9. Click the Save button at the top-left of the tab:

10. In the popup that appears, give the trace a meaningful name:

11. Click OK and the new trace file will be saved in your Downloads folder with the specified name, e.g. SmartScreenDownloadRep.json.gz
12. Using email or another file transfer mechanism, send this file to your debugging partner.
Thanks for your help in improving our service!
-Eric
PS: Your debugging partner will be able to view the SmartScreen traffic by examining the raw JSON content in the log. If you’d like to poke at it yourself, you can look at the data by double-clicking on one of the SendRequestProxy bars in the trace viewer that opened in Step #8:

Impatient optimist. Dad. Author/speaker. Created Fiddler & SlickRun. PM @ MSFT '01-'12, and '18-, working on Office, IE, Edge, and Web Protection. My words are my own, I do not speak for any other entity. View more posts