We’re pleased to present the latest quarterly review and analysis of API vulnerabilities and 2023-2-23 00:2:55 Author: lab.wallarm.com(查看原文) 阅读量:46 收藏
We’re pleased to present the latest quarterly review and analysis of API vulnerabilities and exploits. This time, we’re going to split our discussion into two parts: today this quarterly review, and soon hereafter our year-in-review report.
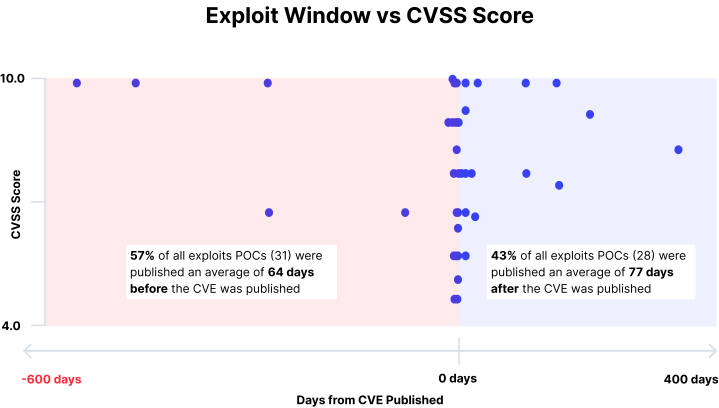
The Q4-2022 ThreatStats™ Report infographic is entitled “Mind the API Time-to-Exploit Gap” because we found a startling negative change in the time between an API CVE being published (which is when most of us find out about a vulnerability) and an associated exploit POC (proof of concept) being published. In addition, we saw that Injection vulnerabilities (API8:2019) overshadow the rest of the OWASP API Security Top-10 risk categories, and that vulnerabilities in Open Source Software (OSS) dominate the CVEs analyzed.
Just as last quarter, there’s a lot more to these data than is apparent on the surface. So, let’s dig into each of the key findings, and then explore the most impactful API CVEs we saw in Q4-2022.
Overview
But first, let’s look at all the API vulnerabilities analyzed in Q4-2022. As in Q3, we see minimal changes in the data pool from the previous quarter:
- No. of Vulnerabilities – up to 213 in Q4, from 203 in Q3 (+5% increase)
- No. of Vendors – down to 122 in Q4, from 129 in Q3 (-5% decrease)
- Pct. of Critical & High rated vulnerabilities – again holding steady at 57% of total
Exploits
The time-to-exploit has now gone negative: the data show that on average exploit POCs are published about three (3) days before the CVE is issued. This compares to an average of four (4) days after in Q3 and 58 days after in Q2. [We did not collect this data in Q1.]

Equally interesting is the total time span – from 557 days before the CVE is published to 322 days after, which is both a huge jump from previous quarters and probably (we hope) not the norm going forward. Regardless, take together these stats suggest your time to react to a published API vulnerability needs to be at Olympic levels. Clearly, proactive real-time protection is required.
Injection Vulnerabilities
Again we see this class of vulnerabilities (API8:2019) dominate the API threat landscape in Q4-2022. These jumped to about 45% all vulnerabilities in Q4 – the highest levels seen in 2022 – from about 34% of in Q3.

And digging deeper, we again see that this category is made up of many variants – 19 different injection types are covered in the Q4-2022 data, which maps to 18 different CWEs. [Note that some numerical discrepancies exist because the CWE assessment on late breaking CVEs was not complete at the time our data snapshot was taken.]

Hence, we suggest that your API vulnerability management (VM) program needs to focus on injections – not only because of the sheer number of injection vulnerabilities being found, and all the variants, but also because it seems we’re seeing a trend develop.
Open-Source Vulnerabilities
One area of interest all year has been whether open-source APIs are more secure because of the “many eyes” notion (aka Linus’s Law). The Q4-2022 data suggest that, at best, we’re in the discovery phase: the number of open-source API vulnerabilities has now reached 67% of all reported vulnerabilities analyzed, a continuation of a trend we’ve seen over the entire year.

Two other OSS-related findings come out as we torture the data a bit more:
- In Q4 we see a convergence in the Dev Tools and Enterprise HW / SW categories, at about 46% each, as opposed to the 52% / 37% split we saw in Q3. The remainder are in the SaaS / Web Services and Cloud Platforms categories.
- In Q4 we see that 69% of all exploit POCs released focused on OSS products, versus 80% in Q3 (albeit from a much smaller basis).
Most Impactful API Vulnerabilities
There are many ways to assess and triage API vulnerabilities for remediation – by CVSS score, by type, by CWE, et cetera. But, as we have in all our past reports, we recommend you consider bringing these top API vulnerabilities to the fore, based on severity, ubiquity and potential impact.
| Vendor / Product | CVE | CVSS | CWE |
| GitLab CE/EE API | CVE-2022-2992 | 9.9 | CWE-77 |
| Fortinet FortiOS, FortiProxy, ForetiSwitchManager | CVE-2022-40684 | 9.8 | CWE-306 |
| Apache Commons Text | CVE-2022-42889 | 9.8 | CWE-94 |
| Hasura GraphQL Engine | CVE-2022-46792 | 8.8 | CWE-732 |
| StarWind Command Center | CVE-2022-23858 | 8.8 | n/a |
| pgAdmin server | CVE-2022-4223 | 8.8 | CWE-94 |
| Grafana | CVE-2022-31130 | 7.5 | CWE-522 |
| Metabase | CVE-2022-43776 | 6.5 | CWE-918 |
| GitLab CE/EE API | CVE-2022-3018 | 4.9 | CWE-668 |
| GitLab CE/EE API | CVE-2022-3325 | 4.3 | CWE-732 |
For more details on these Q4 API vulnerabilities deemed most impactful, see the infographic.
Infographic
For more highlights from our latest vulnerability analysis, take a look at the Q4-2022 API ThreatStats™ Report infographic. We hope you find it interesting and useful, and that it helps you improve your API vulnerability management and security posture.
2022 Year-End Analysis
For a preview of our 2022 Year-End API ThreatStats™ Report, we invite you to register for the on-demand webinar in which Ivan Novikov, CEO & co-founder of Wallarm and noted security researcher, takes a look at what we learned over the course of the year and what our data-driven recommendations for 2023 are.

如有侵权请联系:admin#unsafe.sh