文章声明安全技术类文章仅供参考,此文所提供的信息仅针对漏洞靶场进行渗透,未经授权请勿利用文章内的相关技术从事非法测试,如因此产生的一切不良后果与文章作者和本公众号无关。本文所提供的工具仅用于学 2023-3-7 08:32:34 Author: 浪飒sec(查看原文) 阅读量:135 收藏
一、Spring Boot框架介绍
Spring框架功能很强大,但是就算是一个很简单的项目,我们也要配置很多东西。因此就有了Spring Boot框架,它的作用很简单,就是帮我们自动配置,其设计目的是用来简化新Spring应用的初始搭建以及开发过程。
Spring Boot框架的核心就是自动配置,只要存在相应的jar包,Spring就帮我们自动配置。该框架使用了特定的方式来进行配置,从而使开发人员不再需要定义样板化的配置。如果默认配置不能满足需求,我们还可以替换掉自动配置类,使用我们自己的配置。另外,Spring Boot还集成了嵌入式的Web服务器,系统监控等很多有用的功能,让我们快速构建企业及应用程序。
二、Actuator中间件工具
Actuator是Spring Boot提供的服务监控和管理工具。当Spring Boot应用程序运行时,它会自动将多个端点注册到路由进程中。而由于对这些端点的错误配置,就有可能导致一些敏感信息泄露。
三、确定Spring Boot框架
1、网站的icon文件
2、页面存在特有的报错信息
四、敏感信息泄露漏洞
Spring Boot < 1.5:默认未授权访问所有端点。Spring Boot >= 1.5:默认只允许访问/health和/info端点,但是此安全性通常被应用程序开发人员禁用了。
每个端点的作用和详细描述
路径 描述 默认启用auditevents 显示当前应用程序的审计事件信息 Yesbeans 显示一个应用中所有Spring Beans的完整列表 Yesconditions 显示配置类和自动配置类(configuration and auto-configuration classes)的状态及它们被应用或未被应用的原因configprops 显示一个所有@ConfigurationProperties的集合列表 Yesenv 显示来自Spring的 ConfigurableEnvironment的属性 Yesflyway 显示数据库迁移路径,如果有的话 Yeshealth 显示应用的健康信息(当使用一个未认证连接访问时显示一个简单 的’status’,使用认证连接访问则显示全部信息详情)info 显示任意的应用信息 Yesliquibase 展示任何Liquibase数据库迁移路径,如果有的话 Yesmetrics 展示当前应用的metrics信息 Yesmappings 显示一个所有@RequestMapping路径的集合列表 Yesscheduledtasks 显示应用程序中的计划任务 Yessessions 允许从Spring会话支持的会话存储中检索和删除(retrieval and deletion) 用户会话。使用Spring Session对反应性Web应用程序的支持时不可用。shutdown 允许应用以优雅的方式关闭(默认情况下不启用) Nothreaddump 执行一个线程dump Yesheapdump 返回一个GZip压缩的hprof堆dump文件 Yesjolokia 通过HTTP暴露JMX beans(当Jolokia在类路径上时,WebFlux不可用) Yeslogfile 返回日志文件内容(如果设置了logging.file或logging.path属性的话),支持使用HTTP Range头接收日志文件内容的部分信息 Yesprometheus 以可以被Prometheus服务器抓取的格式显示metrics信息 Yes
1、访问/actuator
如果网站设置了management.endpoints.web.exposure.include为*,那么我们可以在/actuator看到所有存在的端点
2、访问/actuator/version
会泄露一些版本信息
3、访问/env或者/actuator/env
其中可能会泄露数据库账号密码等敏感信息
针对env这种路径下泄露的密码基本上都是加密的,会用星号进行脱敏,想要获取相应的明文密码可以尝试后面通过分析heapdump数据的方式。
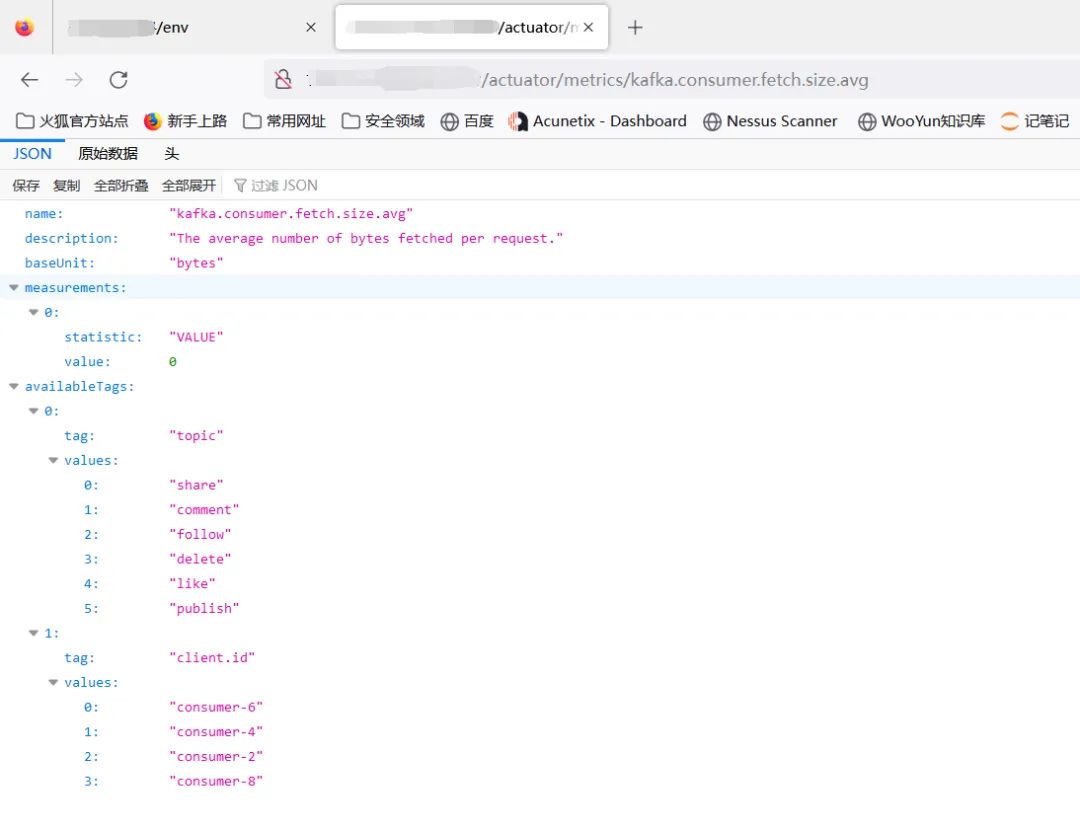
4、访问/actuator/metrics
获得每个度量的名称,其中主要监控了JVM内容使用、GC情况、类加载信息等
如果想要得到每个度量的详细信息,需要传递度量的名称到URL中,如下
http://xx.xx.xx.xx/actuator/metrics5、访问/actuator/threaddump
获取服务器的线程堆栈信息
6、访问/actuator/loggers
获取服务器的日志级别
7、访问/actuator/configprops
查看配置文件中设置的属性内容,以及一些配置属性的默认值
8、访问/actuator/info
展示了关于应用的一般信息,这些信息从编译文件比如META-INF/build-info.properties或者git文件比如git.properties或者任何环境的property中获取
9、访问/actuator/prometheus
获取一些监控指标
10、访问/actuator/mappings
响应信息描述全部的URI路径,以及它们和控制器的映射关系
11、访问/actuator/health
health一般只展示了简单的UP和DOWN状态,比如这样:
为了获得健康检查中所有指标的详细信息,就需要通过在application.yaml中增加如下内容
management:endpoint:health:show-details: always
一旦打开上述开关,那么在/health中可以看到详细内容,比如下面这样
{"status": "UP","diskSpace": {"status": "UP","total": 209715195904,"free": 183253909504,"threshold": 10485760}"db": {"status": "UP","database": "MySQL","hello": 1}}
12、访问/heapdump或者/actuator/heapdump
Heap Dump也叫堆转储文件,是一个Java进程在某个时间点上的内存快照。Heap Dump是有着多种类型的。不过总体上heap dump在触发快照的时候都保存了java对象和类的信息。通常在写heap dump文件前会触发一次FullGC,所以heap dump文件中保存的是FullGC后留下的对象信息。其中可能会含有敏感数据,如数据库的密码明文等。
直接访问路径会返回一个GZip压缩的JVM堆dump,其中是jvm heap信息。下载的heapdump文件大小通常在 50M—500M 之间,有时候也可能会大于 2G。
下载完成之后可以借助一些工具对其中的数据进行内容检索,寻找敏感信息。
推荐工具:
1.Eclipse Memory Analyzer(MAT)
https://www.eclipse.org/mat/downloads.php使用MAT打开heapdump文件
选择使用OQL进行查询
查看所有配置信息的语句,点击上方红色的感叹号执行语句
select * from org.springframework.web.context.support.StandardServletEnvironment查看包含“password”的信息的语句
select * from java.util.LinkedHashMap$Entry s WHERE (toString(s.key).contains("password"))或者select * from java.util.Hashtable$Entry s WHERE (toString(s.key).contains("password"))
查看包含“SESSION”的信息
select * from java.lang.String s WHERE toString(s) LIKE ".*SESSION.*"2.heapdump_tool
https://github.com/wyzxxz/heapdump_tool加载heapdump文件,选择1模式加载文件中所有的对象
查找包含password字段的的对象,返回大量的信息
除了明文密码,还可以查找其他信息getip 获取IP地址信息
getfile 获取文件信息
geturl 获取url信息
3.JDumpSpider
https://github.com/whwlsfb/JDumpSpider使用方法
https://blog.csdn.net/gw5205566/article/details/105666637五、相关脚本和字典
1、Spring Boot敏感端点路径专属字典
%20/swagger-ui.htmlactuatoractuator/auditeventsactuator/beansactuator/conditionsactuator/configpropsactuator/envactuator/healthactuator/heapdumpactuator/httptraceactuator/hystrix.streamactuator/infoactuator/jolokiaactuator/logfileactuator/loggersactuator/mappingsactuator/metricsactuator/scheduledtasksactuator/swagger-ui.htmlactuator/threaddumpactuator/traceapi.htmlapi/index.htmlapi/swagger-ui.htmlapi/v2/api-docsapi-docsauditeventsautoconfigbeanscachescloudfoundryapplicationconditionsconfigpropsdistv2/index.htmldocsdruid/index.htmldruid/login.htmldruid/websession.htmldubbo-provider/distv2/index.htmldumpentity/allenvenv/(name)eurekaflywaygateway/actuatorgateway/actuator/auditeventsgateway/actuator/beansgateway/actuator/conditionsgateway/actuator/configpropsgateway/actuator/envgateway/actuator/healthgateway/actuator/heapdumpgateway/actuator/httptracegateway/actuator/hystrix.streamgateway/actuator/infogateway/actuator/jolokiagateway/actuator/logfilegateway/actuator/loggersgateway/actuator/mappingsgateway/actuator/metricsgateway/actuator/scheduledtasksgateway/actuator/swagger-ui.htmlgateway/actuator/threaddumpgateway/actuator/tracehealthheapdumpheapdump.jsonhttptracehystrixhystrix.streaminfointergrationgraphjolokiajolokia/listliquibaselogfileloggersmappingsmetricsmonitorprometheusrefreshscheduledtaskssessionsshutdownspring-security-oauth-resource/swagger-ui.htmlspring-security-rest/api/swagger-ui.htmlstatic/swagger.jsonsw/swagger-ui.htmlswaggerswagger/codesswagger/index.htmlswagger/static/index.htmlswagger/swagger-ui.htmlswagger-dubbo/api-docsswagger-uiswagger-ui.htmlswagger-ui/htmlswagger-ui/index.htmlsystem/druid/index.htmltemplate/swagger-ui.htmlthreaddumptraceuser/swagger-ui.htmlv1.1/swagger-ui.htmlv1.2/swagger-ui.htmlv1.3/swagger-ui.htmlv1.4/swagger-ui.htmlv1.5/swagger-ui.htmlv1.6/swagger-ui.htmlv1.7/swagger-ui.html/v1.8/swagger-ui.html/v1.9/swagger-ui.html/v2.0/swagger-ui.htmlv2.1/swagger-ui.htmlv2.2/swagger-ui.htmlv2.3/swagger-ui.htmlv2/swagger.jsonwebpage/system/druid/index.html
2、Spring Boot信息泄露扫描脚本
import requestsimport timewith open("url.txt", 'r') as temp:for url in temp.readlines():url = url.strip('\n')with open("SpringBoot信息泄露目录字典.txt", 'r') as web:webs = web.readlines()for web in webs:web = web.strip()u = url + webr = requests.get(u)print("url为:" + u + ' ' + "状态为:%d"%r.status_code + ' ' + "content-length为:" + str(len(r.content)))
如有侵权请联系:admin#unsafe.sh