Loading...

Cloudflare offers many security features like WAF, Bot management, DDoS, Zero Trust, and more! This suite of products are offered in the form of rules to give basic protection against common vulnerability attacks. These rules are usually configured and monitored per domain, which is very simple when we talk about one, two, maybe three domains (or what we call in Cloudflare’s terms, “zones”).
The zone-level overview sometimes is not time efficient
If you’re a Cloudflare customer with tens, hundreds, or even thousands of domains under your control, you’d spend hours going through these domains one by one, monitoring and configuring all security features. We know that’s a pain, especially for our Enterprise customers. That’s why last September we announced the Account WAF, where you can create one security rule and have it applied to the configuration of all your zones at once!
Account WAF makes it easy to deploy security configurations. Following the same philosophy, we want to empower our customers by providing visibility over these configurations, or even better, visibility on all HTTP traffic.
Today, Cloudflare is offering holistic views on the security suite by launching Account Security Analytics and Account Security Events. Now, across all your domains, you can monitor traffic, get insights quicker, and save hours of your time.
How do customers get visibility over security traffic today?
Before today, to view account analytics or events, customers either used to access each zone individually to check the events and analytics dashboards, or used zone GraphQL Analytics API or logs to collect data and send them to their preferred storage provider where they could collect, aggregate, and plot graphs to get insights for all zones under their account — in case ready-made dashboards were not provided.
Introducing Account Security Analytics and Events
The new views are security focused, data-driven dashboards — similar to zone-level views, both have similar data like: sampled logs and the top filters over many source dimensions (for example, IP addresses, Host, Country, ASN, etc.).
The main difference between them is that Account Security Events focuses on the current configurations on every zone you have, which makes reviewing mitigated requests (rule matches) easy. This step is essential in distinguishing between actual threats from false positives, along with maintaining optimal security configuration.
Part of the Security Events power is showing Events “by service” listing the security-related activity per security feature (for example, WAF, Firewall Rules, API Shield) and Events “by Action” (for example, allow, block, challenge).
On the other hand, Account Security Analytics view shows a wider angle with all HTTP traffic on all zones under the account, whether this traffic is mitigated, i.e., the security configurations took an action to prevent the request from reaching your zone, or not mitigated. This is essential in fine-tuning your security configuration, finding possible false negatives, or onboarding new zones.
The view also provides quick filters or insights of what we think are interesting cases worth exploring for ease of use. Many of the view components are similar to zone level Security Analytics that we introduced recently.
To get to know the components and how they interact, let’s have a look at an actual example.
Analytics walk-through when investigating a spike in traffic
Traffic spikes happen to many customers’ accounts; to investigate the reason behind them, and check what’s missing from the configurations, we recommend starting from Analytics as it shows mitigated and non-mitigated traffic, and to revise the mitigated requests to double check any false positives then Security Events is the go to place. That’s what we’ll do in this walk-through starting with the Analytics, finding a spike, and checking if we need further mitigation action.
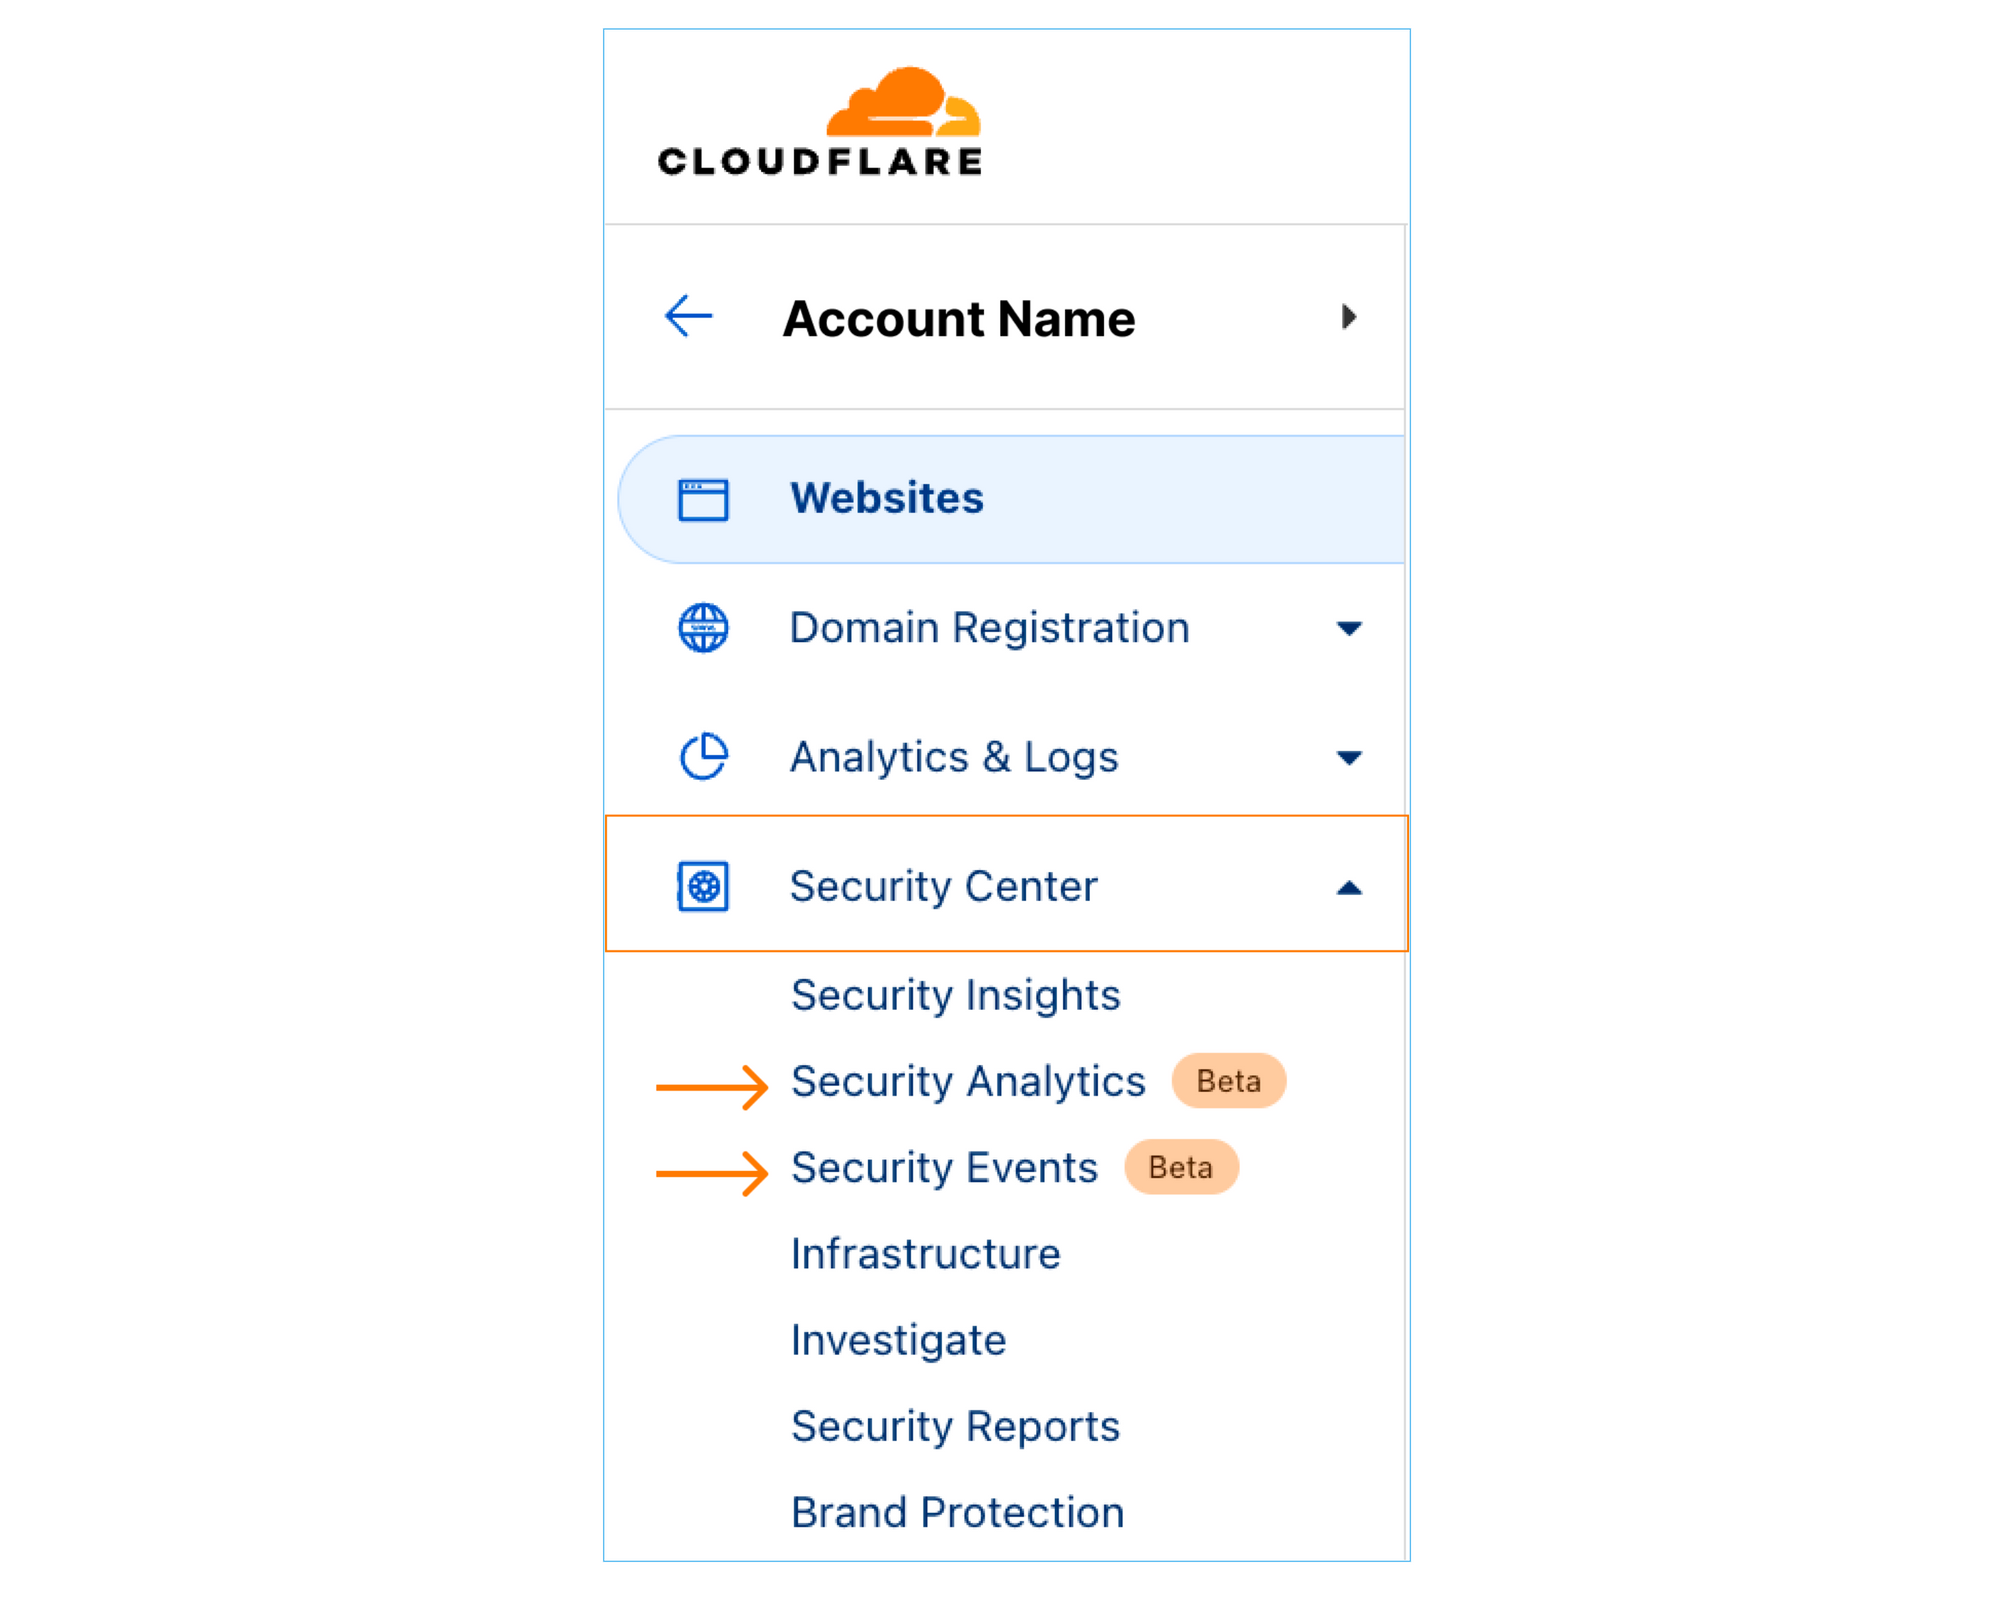
Step 1: To navigate to the new views, sign into the Cloudflare dashboard and select the account you want to monitor. You will find Security Analytics and Security Events in the sidebar under Security Center.
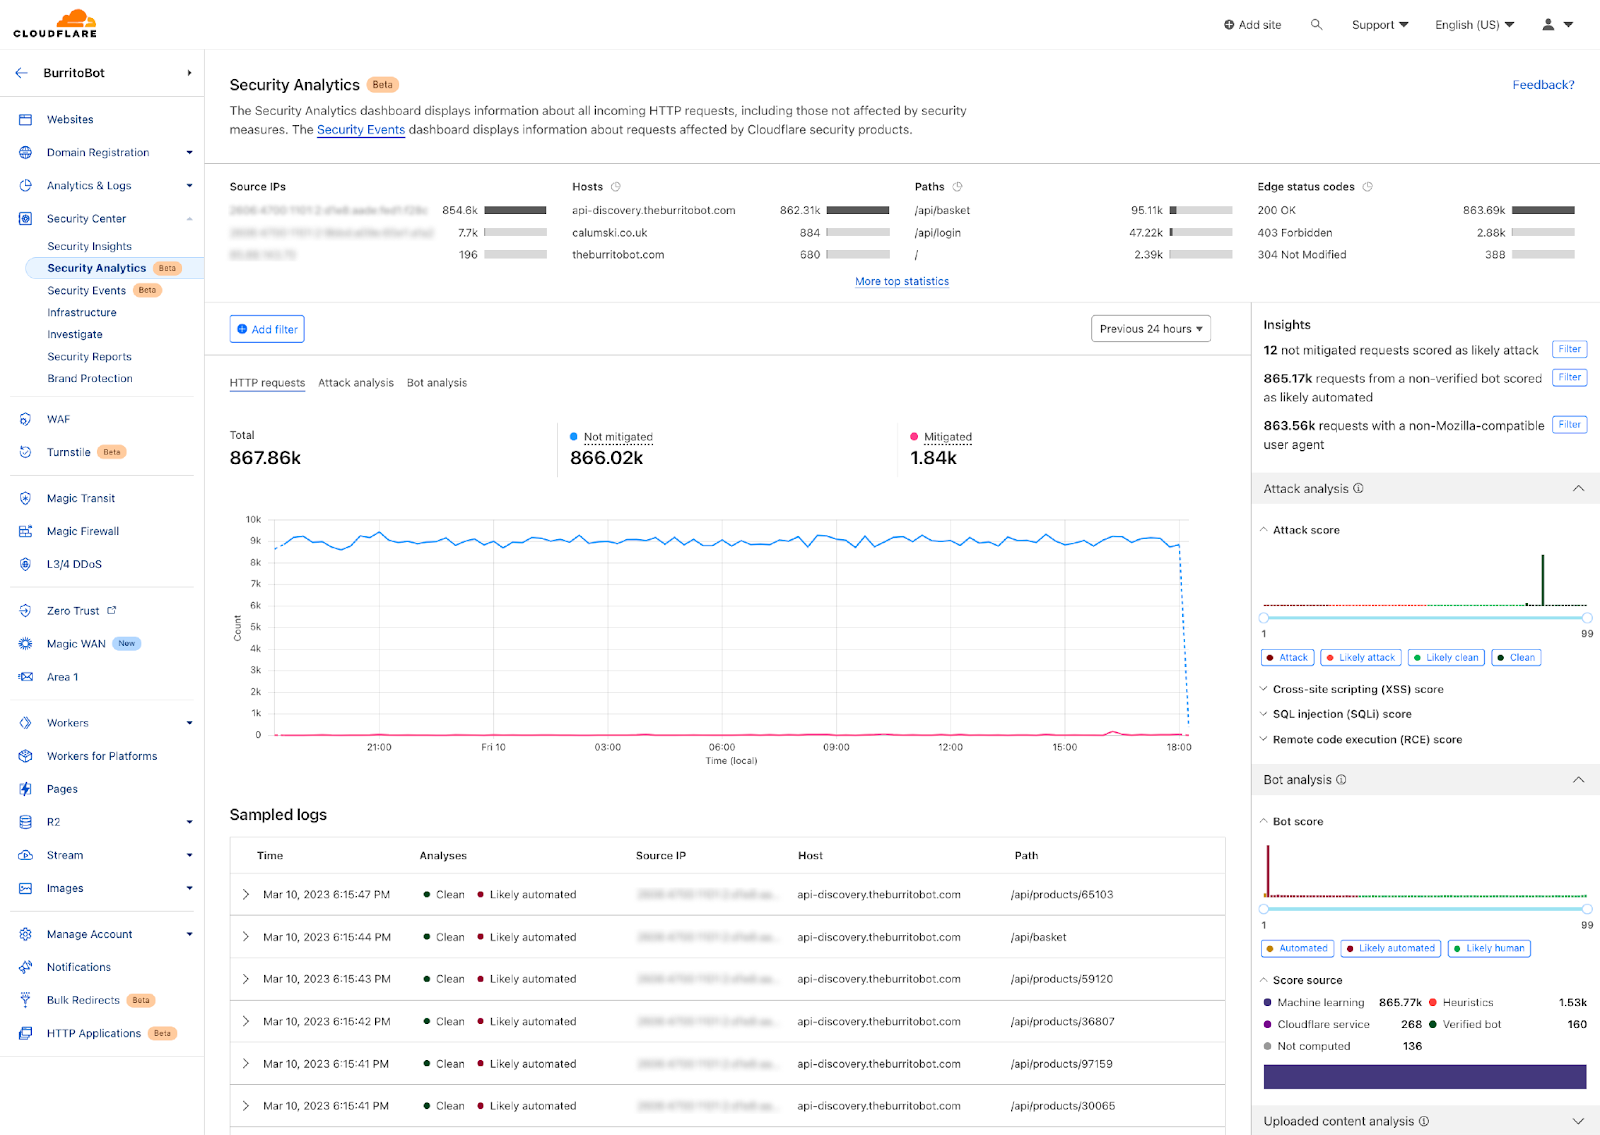
Step 2: In the Analytics dashboard, if you had a big spike in the traffic compared to the usual, there’s a big chance it's a layer 7 DDoS attack. Once you spot one, zoom into the time interval in the graph.
By Expanding the top-Ns on top of the analytics page we can see here many observations:
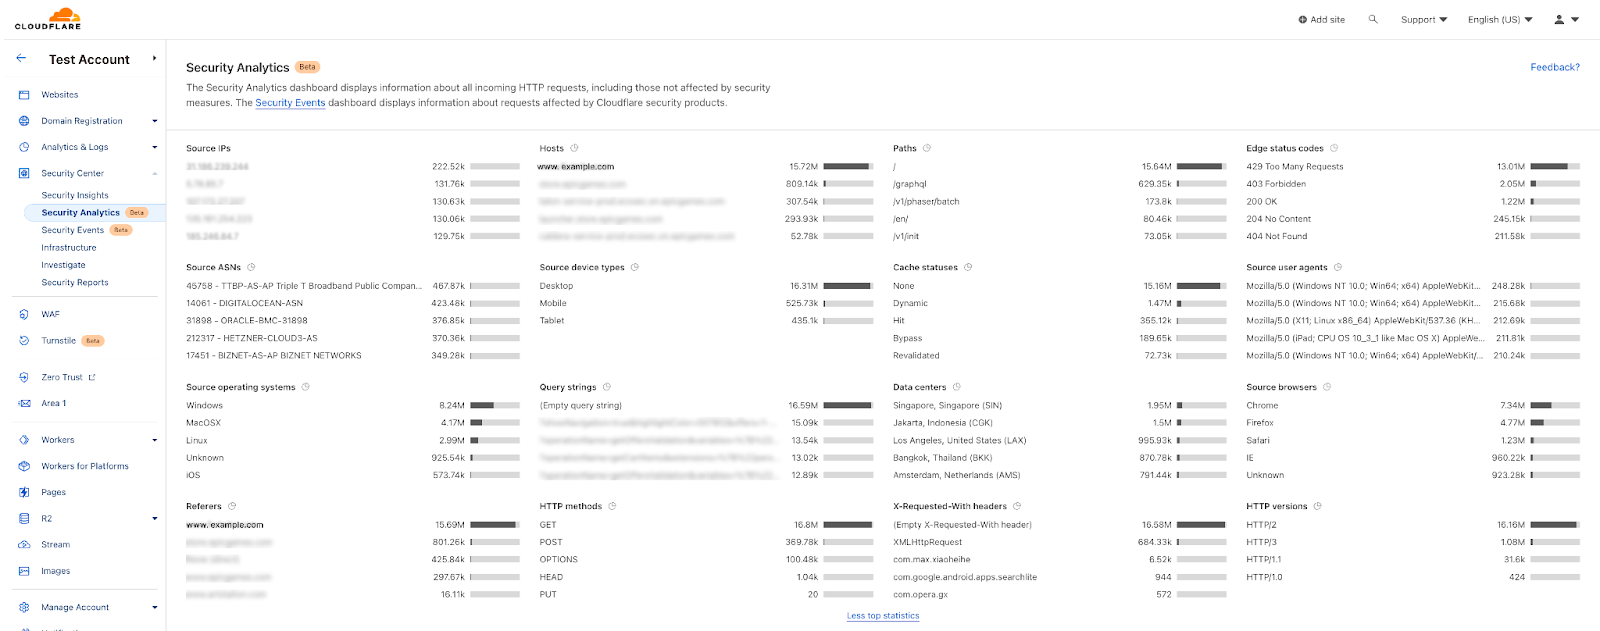
We can confirm it’s a DDoS attack as the peak of traffic does not come from one single IP address, It’s distributed over multiple source IPs. The “edge status code” indicates that there’s a rate limiting rule applied on this attack and it’s a GET method over HTTP/2.
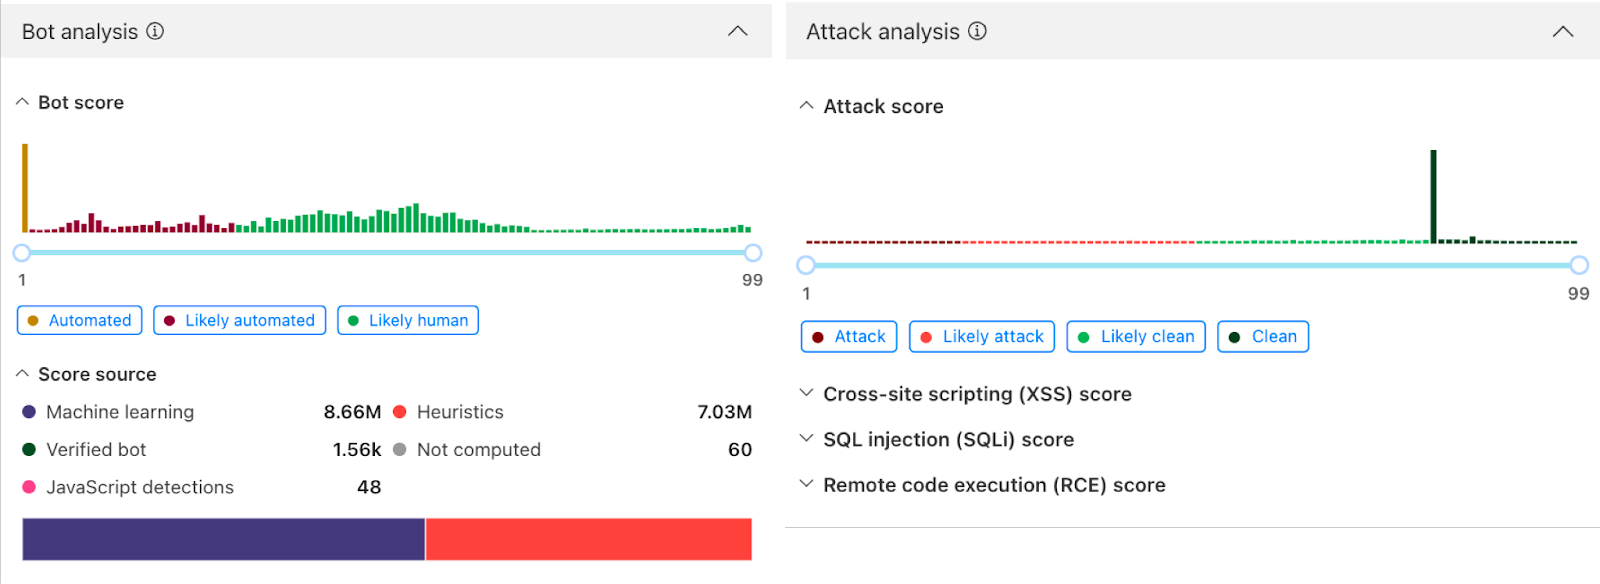
Looking at the right hand side of the analytics we can see “Attack Analysis” indicating that these requests were clean from XSS, SQLi, and common RCE attacks. The Bot Analysis indicates it’s an automated traffic in the Bot Scores distribution; these two products add another layer of intelligence to the investigation process. We can easily deduce here that the attacker is sending clean requests through high volumetric attack from multiple IPs to take the web application down.
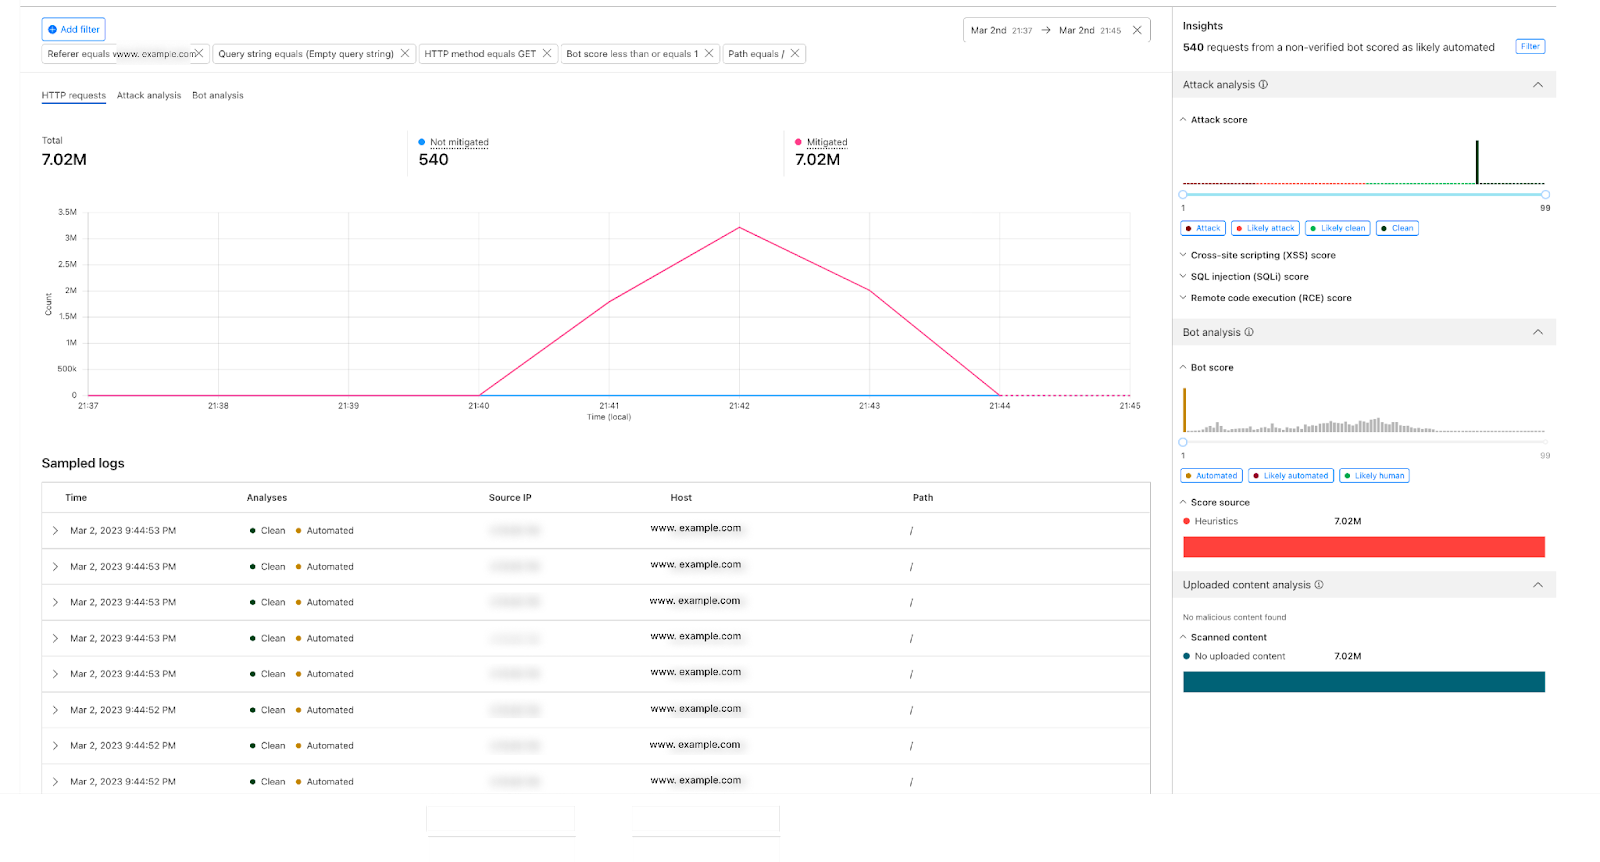
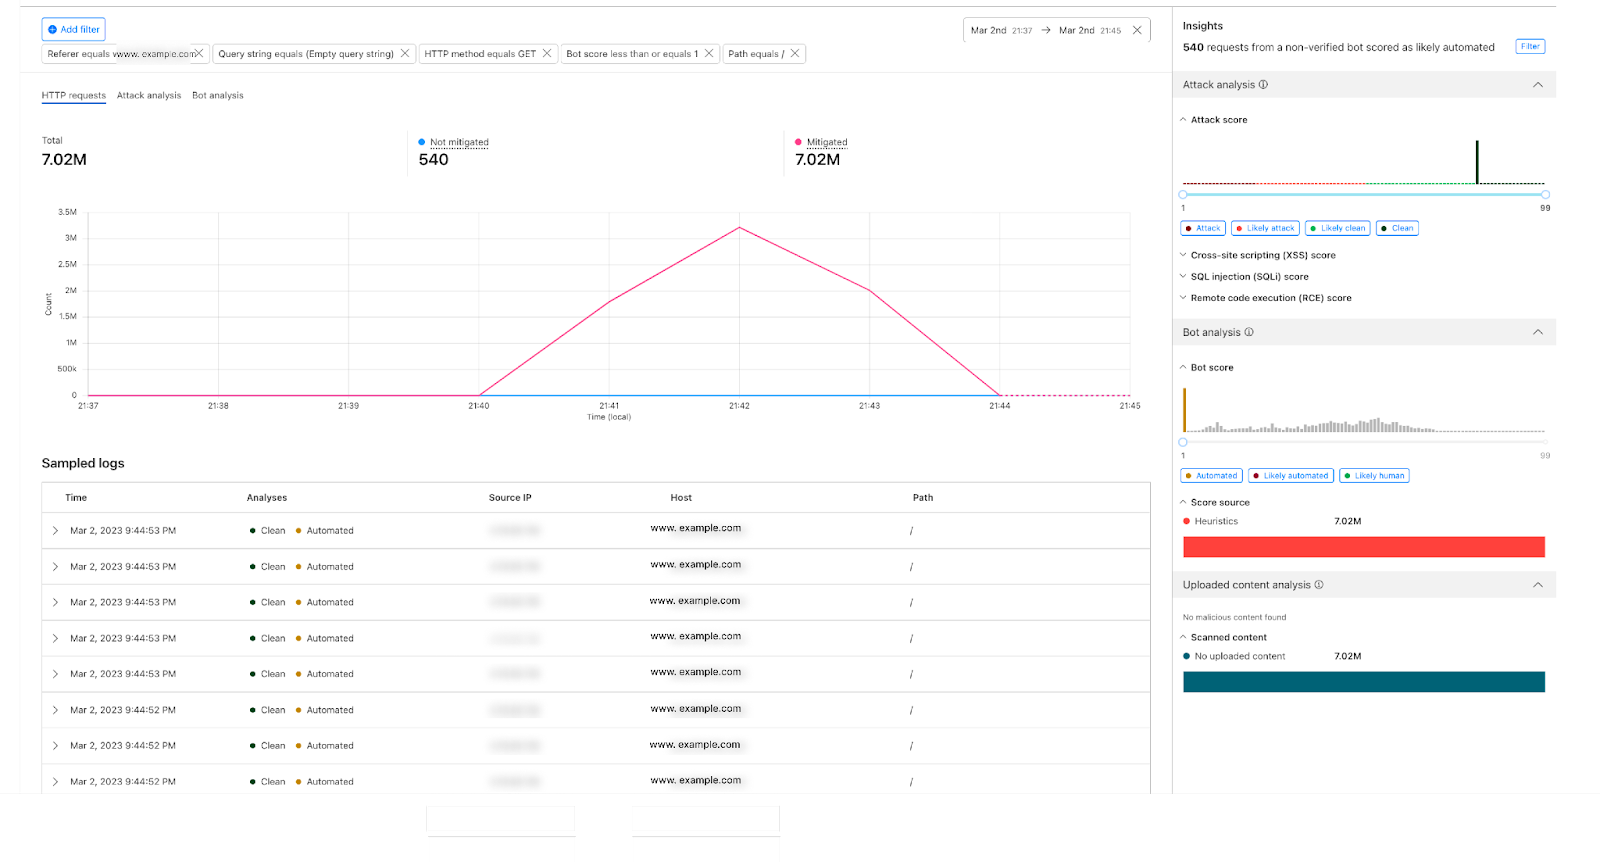
Step 3: For this attack we can see we have rules in place to mitigate it, with the visibility we get the freedom to fine tune our configurations to have better security posture, if needed. we can filter on this attack fingerprint, for instance: add a filter on the referer `www.example.com` which is receiving big bulk of the attack requests, add filter on path equals `/`, HTTP method, query string, and a filter on the automated traffic with Bot score, we will see the following:
Step 4: Jumping to Security Events to zoom in on our mitigation actions in this case, spike fingerprint is mitigated using two actions: Managed Challenge and Block.
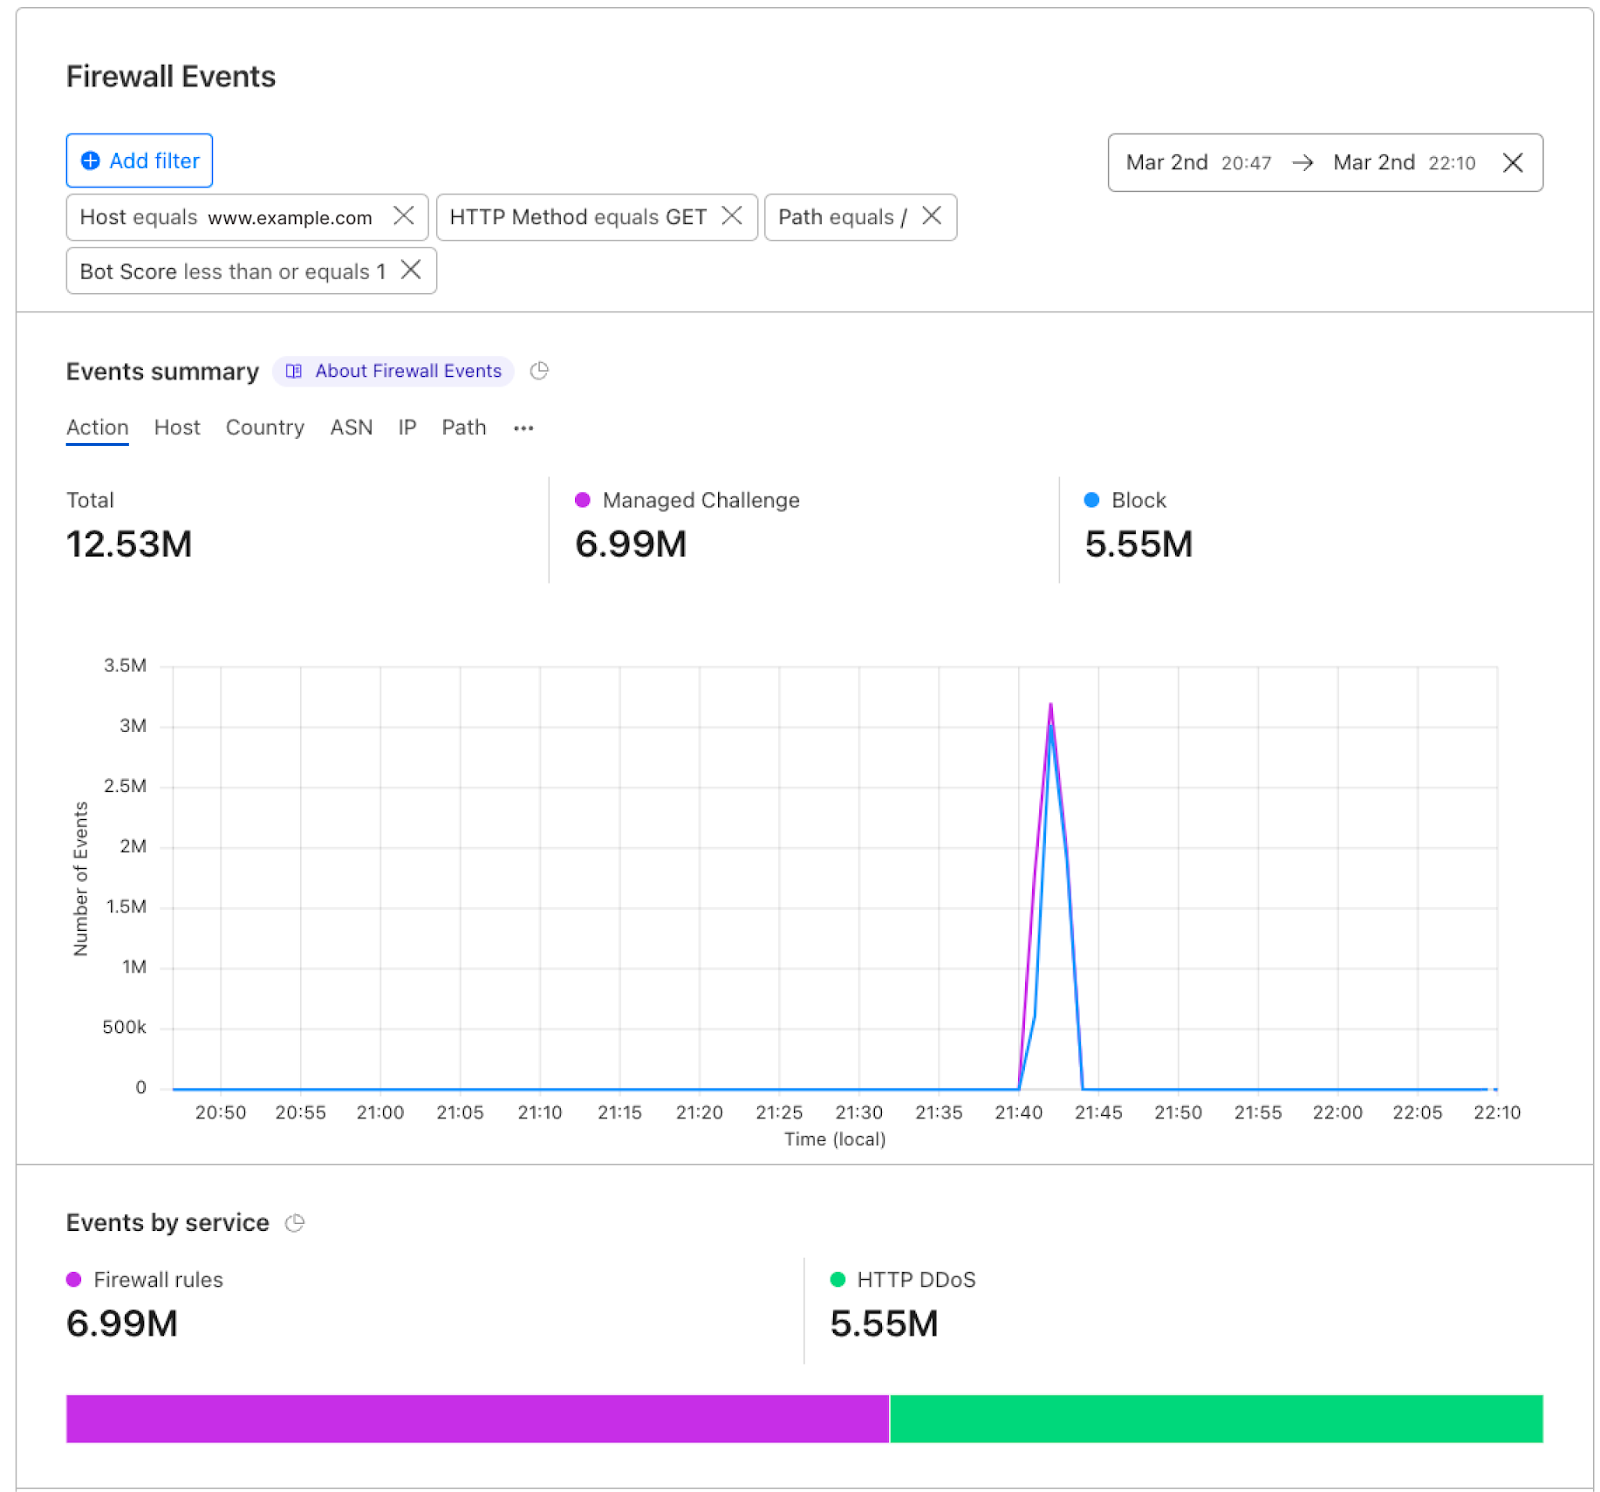
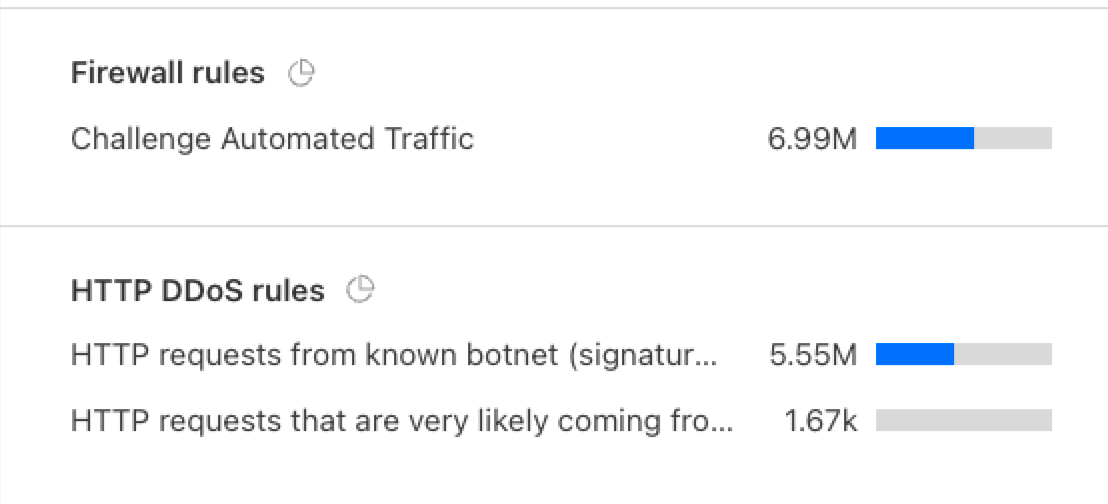
The mitigation happened on: Firewall rules and DDoS configurations, the exact rules are shown in the top events.
Who gets the new views?
Starting this week all our customers on Enterprise plans will have access to Account Security Analytics and Security Events. We recommend having Account Bot Management, WAF Attack Score, and Account WAF to have access to the full visibility and actions.
What’s next?
The new Account Security Analytics and Events encompass metadata generated by the Cloudflare network for all domains in one place. In the upcoming period we will be providing a better experience to save our customers' time in a simple way. We're currently in beta, log into the dashboard, check out the views, and let us know your feedback.
We protect entire corporate networks, help customers build Internet-scale applications efficiently, accelerate any website or Internet application, ward off DDoS attacks, keep hackers at bay, and can help you on your journey to Zero Trust.
Visit 1.1.1.1 from any device to get started with our free app that makes your Internet faster and safer.
To learn more about our mission to help build a better Internet, start here. If you're looking for a new career direction, check out our open positions.
