Note: This is a work-in-progress prototype, please treat it as such. Pull requests are welcome! You can get your feet wet with good first issues
An easy-to-use library for emulating code in minidump files. Here are some links to posts/videos using dumpulator:
- Introduction video with OALabs: Dumpulator - Using Binary Emulation To Automate Reverse Engineering
- Emulating malware with Dumpulator
- Emotet x64 Stack Strings Config Emulation | OALABS Research
- Native function and Assembly Code Invocation
- Guloader string decryption (VEH)
Examples
Calling a function
The example below opens StringEncryptionFun_x64.dmp (download a copy here), allocates some memory and calls the decryption function at 0x140001000 to decrypt the string at 0x140017000:
from dumpulator import Dumpulatordp = Dumpulator("StringEncryptionFun_x64.dmp")
temp_addr = dp.allocate(256)
dp.call(0x140001000, [temp_addr, 0x140017000])
decrypted = dp.read_str(temp_addr)
print(f"decrypted: '{decrypted}'")
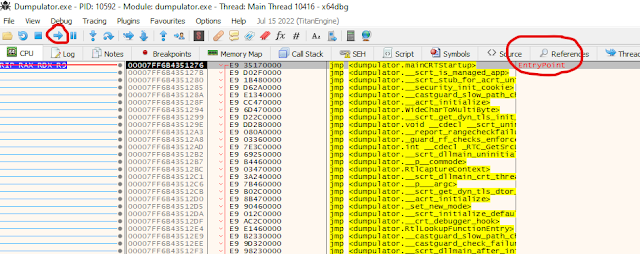
The StringEncryptionFun_x64.dmp is collected at the entry point of the tests/StringEncryptionFun example. You can get the compiled binaries for StringEncryptionFun here
Tracing execution
from dumpulator import Dumpulatordp = Dumpulator("StringEncryptionFun_x64.dmp", trace=True)
dp.start(dp.regs.rip)
This will create StringEncryptionFun_x64.dmp.trace with a list of instructions executed and some helpful indications when switching modules etc. Note that tracing significantly slows down emulation and it's mostly meant for debugging.
Reading utf-16 strings
from dumpulator import Dumpulatordp = Dumpulator("my.dmp")
buf = dp.call(0x140001000)
dp.read_str(buf, encoding='utf-16')
Running a snippet of code
Say you have the following function:
00007FFFC81C06C0 | mov qword ptr [rsp+0x10],rbx       ; prolog_start
00007FFFC81C06C5 | mov qword ptr [rsp+0x18],rsi
00007FFFC81C06CA | push rbp
00007FFFC81C06CB | push rdi
00007FFFC81C06CC | push r14
00007FFFC81C06CE | lea rbp,qword ptr [rsp-0x100]
00007FFFC81C06D6 | sub rsp,0x200                      ; prolog_end
00007FFFC81C06DD | mov rax,qword ptr [0x7FFFC8272510]
You only want to execute the prolog and set up some registers:
from dumpulator import Dumpulatorprolog_start = 0x00007FFFC81C06C0
# we want to stop the instruction after the prolog
prolog_end = 0x00007FFFC81C06D6 + 7
dp = Dumpulator("my.dmp", quiet=True)
dp.regs.rcx = 0x1337
dp.start(start=prolog_start, end=prolog_end)
print(f"rsp: {hex(dp.regs.rsp)}")
The quiet flag suppresses the logs about DLLs loaded and memory regions set up (for use in scripts where you want to reduce log spam).
Custom syscall implementation
You can (re)implement syscalls by using the @syscall decorator:
from dumpulator import *
from dumpulator.native import *
from dumpulator.handles import *
from dumpulator.memory import *@syscall
def ZwQueryVolumeInformationFile(dp: Dumpulator,
                                 FileHandle: HANDLE,
                                 IoStatusBlock: P[IO_STATUS_BLOCK],
                                 FsInformation: PVOID,
                                 Length: ULONG,
                                 FsInformationClass: FSINFOCLASS
                                 ):
    return STATUS_NOT_IMPLEMENTED
All the syscall function prototypes can be found in ntsyscalls.py. There are also a lot of examples there on how to use the API.
To hook an existing syscall implementation you can do the following:
import dumpulator.ntsyscalls as ntsyscalls@syscall
def ZwOpenProcess(dp: Dumpulator,
ProcessHandle: Annotated[P[HANDLE], SAL("_Out_")],
DesiredAccess: Annotated[ACCESS_MASK, SAL("_In_")],
ObjectAttributes: Annotated[P[OBJECT_ATTRIBUTES], SAL("_In_")],
ClientId: Annotated[P[CLIENT_ID], SAL("_In_opt_")]
):
process_id = ClientId.read_ptr()
assert process_id == dp.parent_process_id
ProcessHandle.write_ptr(0x1337)
return STATUS_SUCCESS
@syscall
def ZwQueryInformationProcess(dp: Dumpulator,
ProcessHandle: Annotated[HANDLE, SAL("_In_")],
ProcessInformationClass: Annotated[PROCESSINFOCLASS, SAL("_In_")],
ProcessInformation: Annotated[PVOID, SAL("_Out_wri tes_bytes_(ProcessInformationLength)")],
ProcessInformationLength: Annotated[ULONG, SAL("_In_")],
ReturnLength: Annotated[P[ULONG], SAL("_Out_opt_")]
):
if ProcessInformationClass == PROCESSINFOCLASS.ProcessImageFileNameWin32:
if ProcessHandle == dp.NtCurrentProcess():
main_module = dp.modules[dp.modules.main]
image_path = main_module.path
elif ProcessHandle == 0x1337:
image_path = R"C:\Windows\explorer.exe"
else:
raise NotImplementedError()
buffer = UNICODE_STRING.create_buffer(image_path, ProcessInformation)
assert ProcessInformationLength >= len(buffer)
if ReturnLength.ptr:
dp.write_ulong(ReturnLength.ptr, len(buffer))
ProcessInformation.write(buffer)
return STATUS_SUCCESS
return ntsyscal ls.ZwQueryInformationProcess(dp,
ProcessHandle,
ProcessInformationClass,
ProcessInformation,
ProcessInformationLength,
ReturnLength
)
Custom structures
Since v0.2.0 there is support for easily declaring your own structures:
from dumpulator.native import *class PROCESS_BASIC_INFORMATION(Struct):
    ExitStatus: ULONG
    PebBaseAddress: PVOID
    AffinityMask: KAFFINITY
    BasePriority: KPRIORITY
    UniqueProcessId: ULONG_PTR
    InheritedFromUniqueProcessId: ULONG_PTR
To instantiate these structures you have to use a Dumpulator instance:
pbi = PROCESS_BASIC_INFORMATION(dp)
assert ProcessInformationLength == Struct.sizeof(pbi)
pbi.ExitStatus = 259  # STILL_ACTIVE
pbi.PebBaseAddress = dp.peb
pbi.AffinityMask = 0xFFFF
pbi.BasePriority = 8
pbi.UniqueProcessId = dp.process_id
pbi.InheritedFromUniqueProcessId = dp.parent_process_id
ProcessInformation.write(bytes(pbi))
if ReturnLength.ptr:
    dp.write_ulong(ReturnLength.ptr, Struct.sizeof(pbi))
return STATUS_SUCCESS
If you pass a pointer value as a second argument the structure will be read from memory. You can declare pointers with myptr: P[MY_STRUCT] and dereferences them with myptr[0].
Collecting the dump
There is a simple x64dbg plugin available called MiniDumpPlugin The minidump command has been integrated into x64dbg since 2022-10-10. To create a dump, pause execution and execute the command MiniDump my.dmp.
Installation
python -m pip install dumpulator
To install from source:
Install for a development environment:
Related work
- Dumpulator-IDA: This project is a small POC plugin for launching dumpulator emulation within IDA, passing it addresses from your IDA view using the context menu.
- wtf: Distributed, code-coverage guided, customizable, cross-platform snapshot-based fuzzer designed for attacking user and / or kernel-mode targets running on Microsoft Windows
- speakeasy: Windows sandbox on top of unicorn.
- qiling: Binary emulation framework on top of unicorn.
- Simpleator: User-mode application emulator based on the Hyper-V Platform API.
What sets dumpulator apart from sandboxes like speakeasy and qiling is that the full process memory is available. This improves performance because you can emulate large parts of malware without ever leaving unicorn. Additionally only syscalls have to be emulated to provide a realistic Windows environment (since everything actually is a legitimate process environment).
Credits
- herrcore for inspiring me to make this
- secret club
- JetBrains for free PyCharm license!
- Image by GraphiqaStock on Freepik


