2023-7-31 15:34:0 Author: paper.seebug.org(查看原文) 阅读量:17 收藏
Author: Knownsec 404 Team
Chinese version:https://paper.seebug.org/2093/
After obtaining the mapping data in cyberspace, to analyze the data and interpret the data, and let the data speak, which is the "soul of the data" often said by the ZoomEye team, and is also the real value of the mapping in cyberspace. Cyberspace surveying and mapping data can not only be applied to the field of cyberspace to perceive the situation at the level of cyberspace, but also can be combined with the data of other industries to confirm and perceive the situation of real physical space through analysis and mining, so as to give play to its greater value.
India and Pakistan are two neighboring countries in South Asia. Based on the surveying and mapping data of ZoomEye cyberspace search engine [1], this paper conducts a comparative analysis of the two countries from multiple dimensions, and interprets them in combination with data from other industries.
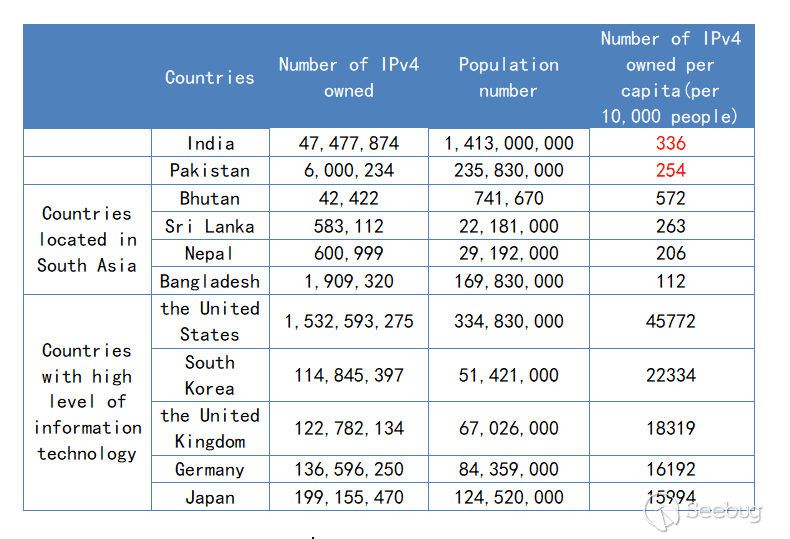
Comparing the number of IPv4 addresses per capita of the two countries, India is slightly higher than Pakistan, reflecting that India's informatization level is slightly higher than Pakistan's. Horizontal comparison with other countries in South Asia (e.g. Bhutan, Sri Lanka, Nepal, Bangladesh), which are at the same level of informationization; Horizontal comparison with countries with a high level of information technology (such as the United States, South Korea, the United Kingdom, Germany, Japan) shows a large gap.
Comparing the proportion of online IPv4 addresses (where "online IPv4 address" refers to the IPv4 address that provides a certain protocol service on a certain port open to the Internet) in the total number of IPv4 addresses in two countries in 2022, India is higher than Pakistan, indicating that India is higher than Pakistan in the rate of IP address service provision. It reflects the higher level of information technology in India than in Pakistan.
We observe the change trend of GDP and online IPv4 number of the two countries in the past four years, and find that: GDP and online IPv4 number of the two countries have a significant decline in 2020, and an upward trend in 2021 and 2022. Speculated reasons: Due to the impact of the global epidemic, the two countries have an economic recession in 2020, and correspondingly fewer Internet application services, so the number of online IPv4 addresses has declined. As the economy recovers in 2021 and 2022 and Internet application services increase, the number of online IPv4 addresses shows an upward trend.
Comparing the proportion of IPv4 assets using SSL/TLS protocol in the total assets of the two countries, India is higher than Pakistan; Comparing the ratio of firewall equipment assets to total assets of the two countries, India is also higher than Pakistan; The comparison of the data of these two dimensions reflects that the level of information construction security in India is higher than that in Pakistan.
For IPv4 assets that use SSL/TLS protocol, we extract keyword samples in SSL certificates to analyze and compare device manufacturers. We can find that: The market coverage of American device manufacturers in the two countries is basically the same; In comparison, the market coverage of Chinese equipment manufacturers is relatively low. These show that in the context of the "Belt and Road" initiative, Chinese equipment manufacturers have broad room for growth in overseas markets.
2.1 Population and Economy
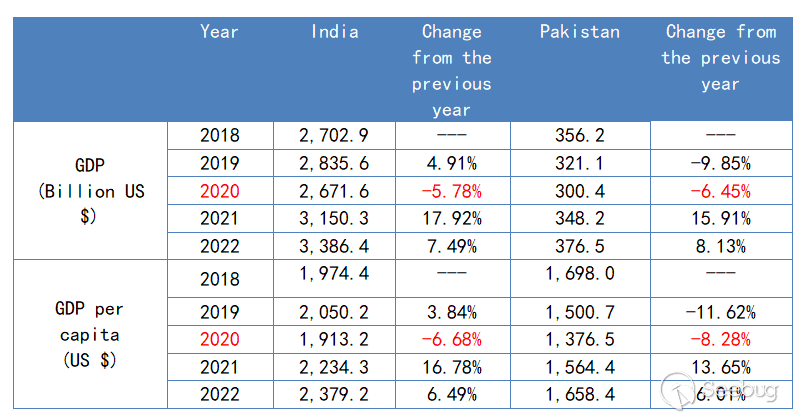
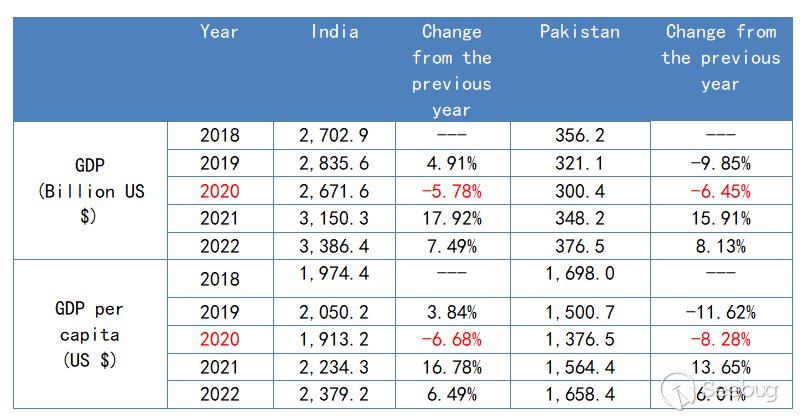
The population of India (1.413 billion) is six times that of Pakistan (235 million). [2] In 2022, India's GDP [3] is 9 times that of Pakistan [4], and India's GDP per capita is 1.43 times that of Pakistan as shown in Table 1. Due to the impact of the global pandemic, India and Pakistan have experienced significant economic recessions in 2020; In 2021 and 2022, both economies recovered. As can be seen from the data, India's national economic strength is stronger than Pakistan's.
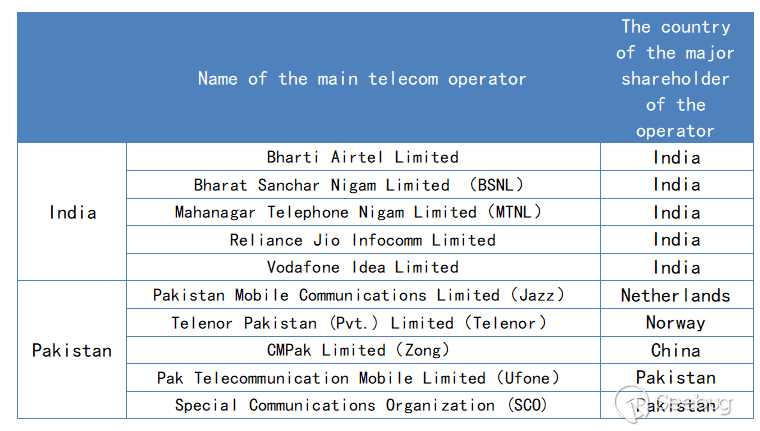
Five major operators in India [5], whose major shareholders belong to India itself; Of the four major operators in Pakistan [6], only one of the major shareholders belongs to Pakistan itself, and the other three belong to the Netherlands, Norway and China, as shown in Table 2. From this dimension, the comparison can be reflected to a certain extent: India's communication infrastructure capacity is higher than Pakistan's, and it is mainly dominated by the country itself.
Among them, CMPak Limited, located in Pakistan, is the first overseas communication network of China Mobile and an important practice for China Mobile to participate in the construction of the "Belt and Road" [7].
3.1 Total number of IPv4 addresses owned
We compare the number of IPv4 addresses in two countries and their annual change [8]. Detailed data are shown in the Table 3 below. It can be seen that India ranks 13th in the number of IPv4 addresses in the world, and its absolute value is much higher than that of Pakistan (ranking 51st in the world). In terms of annual changes, the number of IPv4 addresses in the two countries showed an overall upward trend from 2021 to 2023, which is speculated to be related to the economic recovery of the two countries after the epidemic.

3.2 Number of IPv4 owned per capita
The comparison of the absolute number of IPv4 addresses may not be able to truly reflect the current information level of the two countries. Therefore, next, we compare the number of IPv4 addresses per capita in the two countries. Detailed data are shown in the Table 4 below. It can be seen that the number of IPv4 addresses per capita in India is slightly higher than that in Pakistan, reflecting that India's informatization level is slightly higher than Pakistan's to some extent. Compared with countries with high information level (such as the United States, South Korea, the United Kingdom, Germany, Japan), the gap is relatively large; When compared horizontally with other countries in South Asia (e.g. Bhutan, Sri Lanka, Nepal, Bangladesh), these countries are on the same level of informationization.
4.1 The number of online IPv4 and the proportion of the total
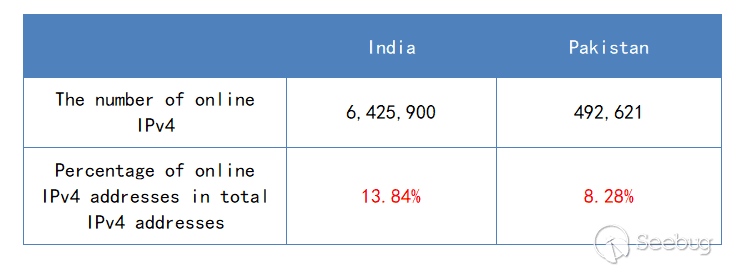
Comparing the number of online IPv4 addresses (where "online IPv4 addresses" refers to IPv4 addresses that provide a protocol service on a port open to the Internet) in 2022 between the two countries, India has a higher absolute number than Pakistan; Comparing the proportion of online IPv4 addresses in the total number of IPv4 addresses in the two countries in 2022, India is 13.84% and Pakistan is 8.28%, as shown in Table 5, indicating that India's IP address service provision rate is higher than Pakistan's, reflecting India's informatization level is higher than Pakistan's.
4.2 Trend of the number of online IPv4 addresses
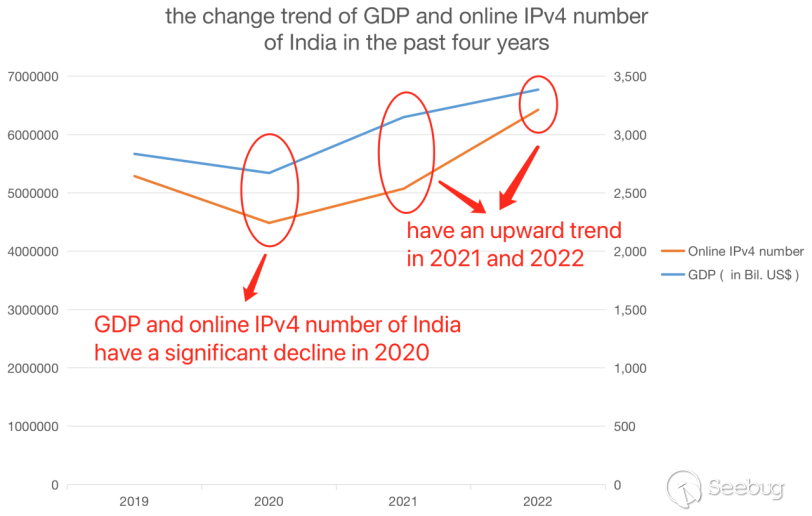
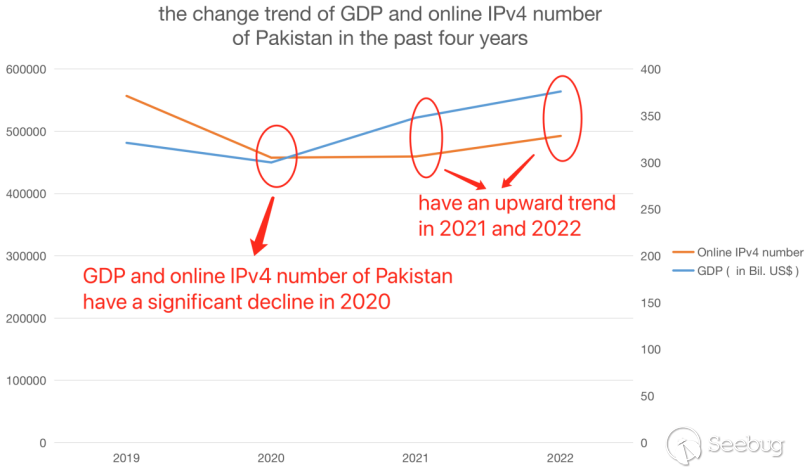
Next, we look at the changes in the number of online IPv4 addresses in the two countries in the past four years, and see Table 6 below for detailed data. It can be seen that the number of online IPv4 addresses in both countries has a significant decline in 2020, and then an upward trend in 2021 and 2022.

We observe the change trend of GDP and online IPv4 number of the two countries in the past four years, and find that: GDP and online IPv4 number of the two countries have a significant decline in 2020, and an upward trend in 2021 and 2022, as shown in Figure 1 and Figure 2. Speculated reasons: Due to the impact of the global epidemic, the two countries have an economic recession in 2020, and correspondingly fewer Internet application services, so the number of online IPv4 addresses has declined. As the economy recovers in 2021 and 2022 and Internet application services increase, the number of online IPv4 addresses shows an upward trend.
In this chapter, we select specific IP device asset data for comparative analysis.
5.1 SSL/TLS Assets and Firewall Assets
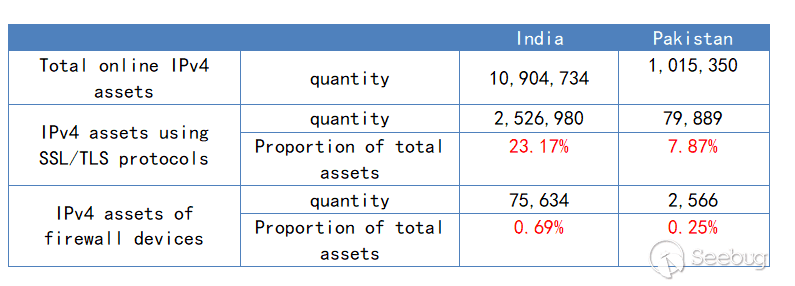
We extracted IPv4 assets using SSL/TLS protocols in these two countries and calculated their proportion in the total number of online IPv4 assets. India's ratio was 23.17%, while Pakistan's ratio was 7.87%, as shown in Table 7.
Then, we extract the firewall device assets of these two countries and calculate their proportion in the total number of assets. The ratio of India is 0.69%, which is equivalent to using an average of one firewall to protect 145 IP assets. In Pakistan, the ratio is 0.25%, which is equivalent to an average of 400 IP assets protected by one firewall.
The comparison of the data of these two dimensions can reflect, to a certain extent that the security level of information construction in India is higher than that in Pakistan.
5.2 Device assets of different manufacturers
Next, for IPv4 assets that use SSL/TLS protocols, we extract keyword samples in SSL certificates for analysis and comparison by device manufacturers. The data analysis here is based on the keywords in SSL certificates. Therefore, when we calculate the proportion of the number of assets of the device manufacturer, it is not the proportion of the total number of online assets, but the proportion of the number of assets using SSL/TLS protocol. (Note: Extracting the device manufacturer keyword sample from the SSL certificate does not mean that all manufacturers are covered, nor does it mean that all device models of a manufacturer are covered.)
Through the detailed data in Table 8, it can be seen that in the two countries, the number of assets of the four American equipment manufacturers is basically the same.

The comparison of data in this dimension can reflect that: the market coverage of American device manufacturers in the two countries is basically the same; In comparison, the market coverage of Chinese equipment manufacturers is relatively low. These show that in the context of the "Belt and Road" initiative, Chinese device manufacturers have broad room for growth in overseas markets.
Based on the surveying and mapping data of ZoomEye cyberspace search engine, this paper conducts a comparative analysis of India and Pakistan from multiple dimensions, and the data can reflect that the informatization level of India is higher than that of Pakistan.
The combined interpretation of cyberspace mapping data and national GDP data can reflect the economic recession in the two countries in 2020, and the corresponding lack of Internet application services, so the number of online IPv4 addresses has declined. As the economy recovers in 2021 and 2022, Internet application services will also increase, so the number of online IPv4 addresses will show an upward trend.
The comparative analysis of device assets mapping data shows that the market coverage of American device manufacturers in these two countries is higher than that of Chinese device manufacturers. It shows that in the context of the "Belt and Road" initiative, Chinese device manufacturers have broad room for growth in overseas markets.
Based on the surveying and mapping data in cyberspace, it can not only perceive the situation at the cyberspace level, but also combine with the data in other industries to confirm and perceive the situation of the real entity space through analysis and mining, which is also the charm of the surveying and mapping data in cyberspace.
[1] ZoomEye cyberspace search engine
https://www.zoomeye.org
[2] Population of the country Different countries and regions population list at https://zh.wikipedia.org/zh-hans/
[3] India's GDP
https://en.wikipedia.org/wiki/Economy_of_India
[4] GDP of Pakistan
https://en.wikipedia.org/wiki/Economy_of_Pakistan
[5] Telecom operators in India
https://en.wikipedia.org/wiki/List_of_telecom_companies_in_India
[6] Telecommunications operators in Pakistan
https://en.wikipedia.org/wiki/List_of_telecommunication_companies_in_Pakistan
[7] China Mobile has built the "Belt and Road" information highway
http://ccnews.people.com.cn/n1/2019/0701/c141677-31204950.html
[8] The number of IPv4 addresses a country has Data from the IP Geolocation library of Evan Inc.
 本文由 Seebug Paper 发布,如需转载请注明来源。本文地址:https://paper.seebug.org/2094/
如有侵权请联系:admin#unsafe.sh