
- 1. Abstract
- 2. Online IP count by country in 2022
- 3. National GDP data for 2022
- 4. Comparison of national GDP and online IP volume in 2022
- 5. The top 20 countries in GDP and online IP volume in the past five years
- 6. Comparison of the growth rate of national GDP and the number of online IP in the last five years
- 7. Conclusion
- 8. Reference
Author: Knownsec 404 Team
Chinese version: https://paper.seebug.org/3015/
1. Abstract
After obtaining the mapping data in cyberspace, to analyze the data and interpret the data, and let the data speak, which is the "soul of the data" often said by the ZoomEye team, and is also the real value of the mapping in cyberspace. Cyberspace surveying and mapping data can not only be applied to the field of cyberspace to perceive the situation at the level of cyberspace, but also can be combined with the data of other industries to confirm and perceive the situation of real physical space through analysis and mining, so as to give play to its greater value.
In this article, the ZoomEye team analyzes the cyberspace mapping data [1] and GDP data [2] of various countries around the world in the past five years, exploring the correlation between these two cross-industry datasets.
Based on our analysis of the top 20 countries in global GDP rankings for the year 2022, regarding their online IP count and GDP data, we found the following:
- The top 13 countries in terms of global GDP ranking also hold the top 13 positions in terms of online IP address quantity ranking.
- The United States has a global GDP proportion of 25.32%, while its online IP address proportion is 24.87%. These two proportions are highly similar, both approximately one-fourth.
- South Korea has a digital economy proportion to GDP of 53.18%, which is comparatively high when horizontally compared with other countries, ranking 4th globally. Therefore, in relative terms, South Korea showcases a higher level of internet development, aligning with its online IP address ranking (5th) being higher than its GDP ranking (13th).
We conducted an analysis on the top 20 countries in global GDP ranking for each year over the past five years and discovered that 84% of these countries also ranked within the top 20 in terms of online IP address quantity during the same year.
Next, we selected 67 countries with GDP values exceeding 100 billion US dollars in 2022 and analyzed the growth rates of their online IP count and GDP data over the past five years. Firstly, we calculated the average annual GDP growth rate for these 67 countries during the five-year period and ranked them accordingly. The top three countries in terms of GDP growth rate were Ireland, Ethiopia, and Bangladesh. Secondly, we calculated the average annual growth rate of online IP count for these 67 countries over the past five years and ranked them. It was found that Ireland, Ethiopia, and Bangladesh, the three countries with the fastest economic growth, also ranked in the top 10 globally in terms of average annual growth rate of online IP count during the same period. They ranked 9th, 2nd, and 8th respectively.
Through the comparative analysis of the above data, we found a strong positive correlation between the scale of a country's online IP count and its GDP. The growth rate of online IP count also exhibits a certain positive correlation with GDP growth rate. This correlation is also influenced by the level of internet development in each country: countries with a higher proportion of digital economy to GDP are more likely to have a higher global ranking in terms of online IP count compared to their GDP ranking, while countries with a lower proportion of digital economy to GDP are more likely to have a lower global ranking in terms of online IP count compared to their GDP ranking.
Cyberspace mapping data should not be limited to the cybersecurity industry for purposes such as asset discovery and vulnerability assessment. It has the potential to be widely applied in various industries. Geospatial mapping data has long been widely used across different sectors, and I believe that cyberspace mapping data will also be extensively utilized in multiple industries in the near future, thereby unleashing its greater value.
Note:
- In this context, "online IP" refers to IPv4 addresses that provide certain protocol services by opening a specific port on the internet.
- Online IP count and other cyberspace mapping data are sourced from the ZoomEye cyberspace search engine [1].
- GDP data is sourced from the World Bank's public data [2], with GDP measured in current US dollars and GDP growth rate measured as annual percentage.
- Data on the scale of national digital economies is sourced from the report "Global Digital Economy White Paper (2022)" by the China Academy of Information and Communications Technology [3].
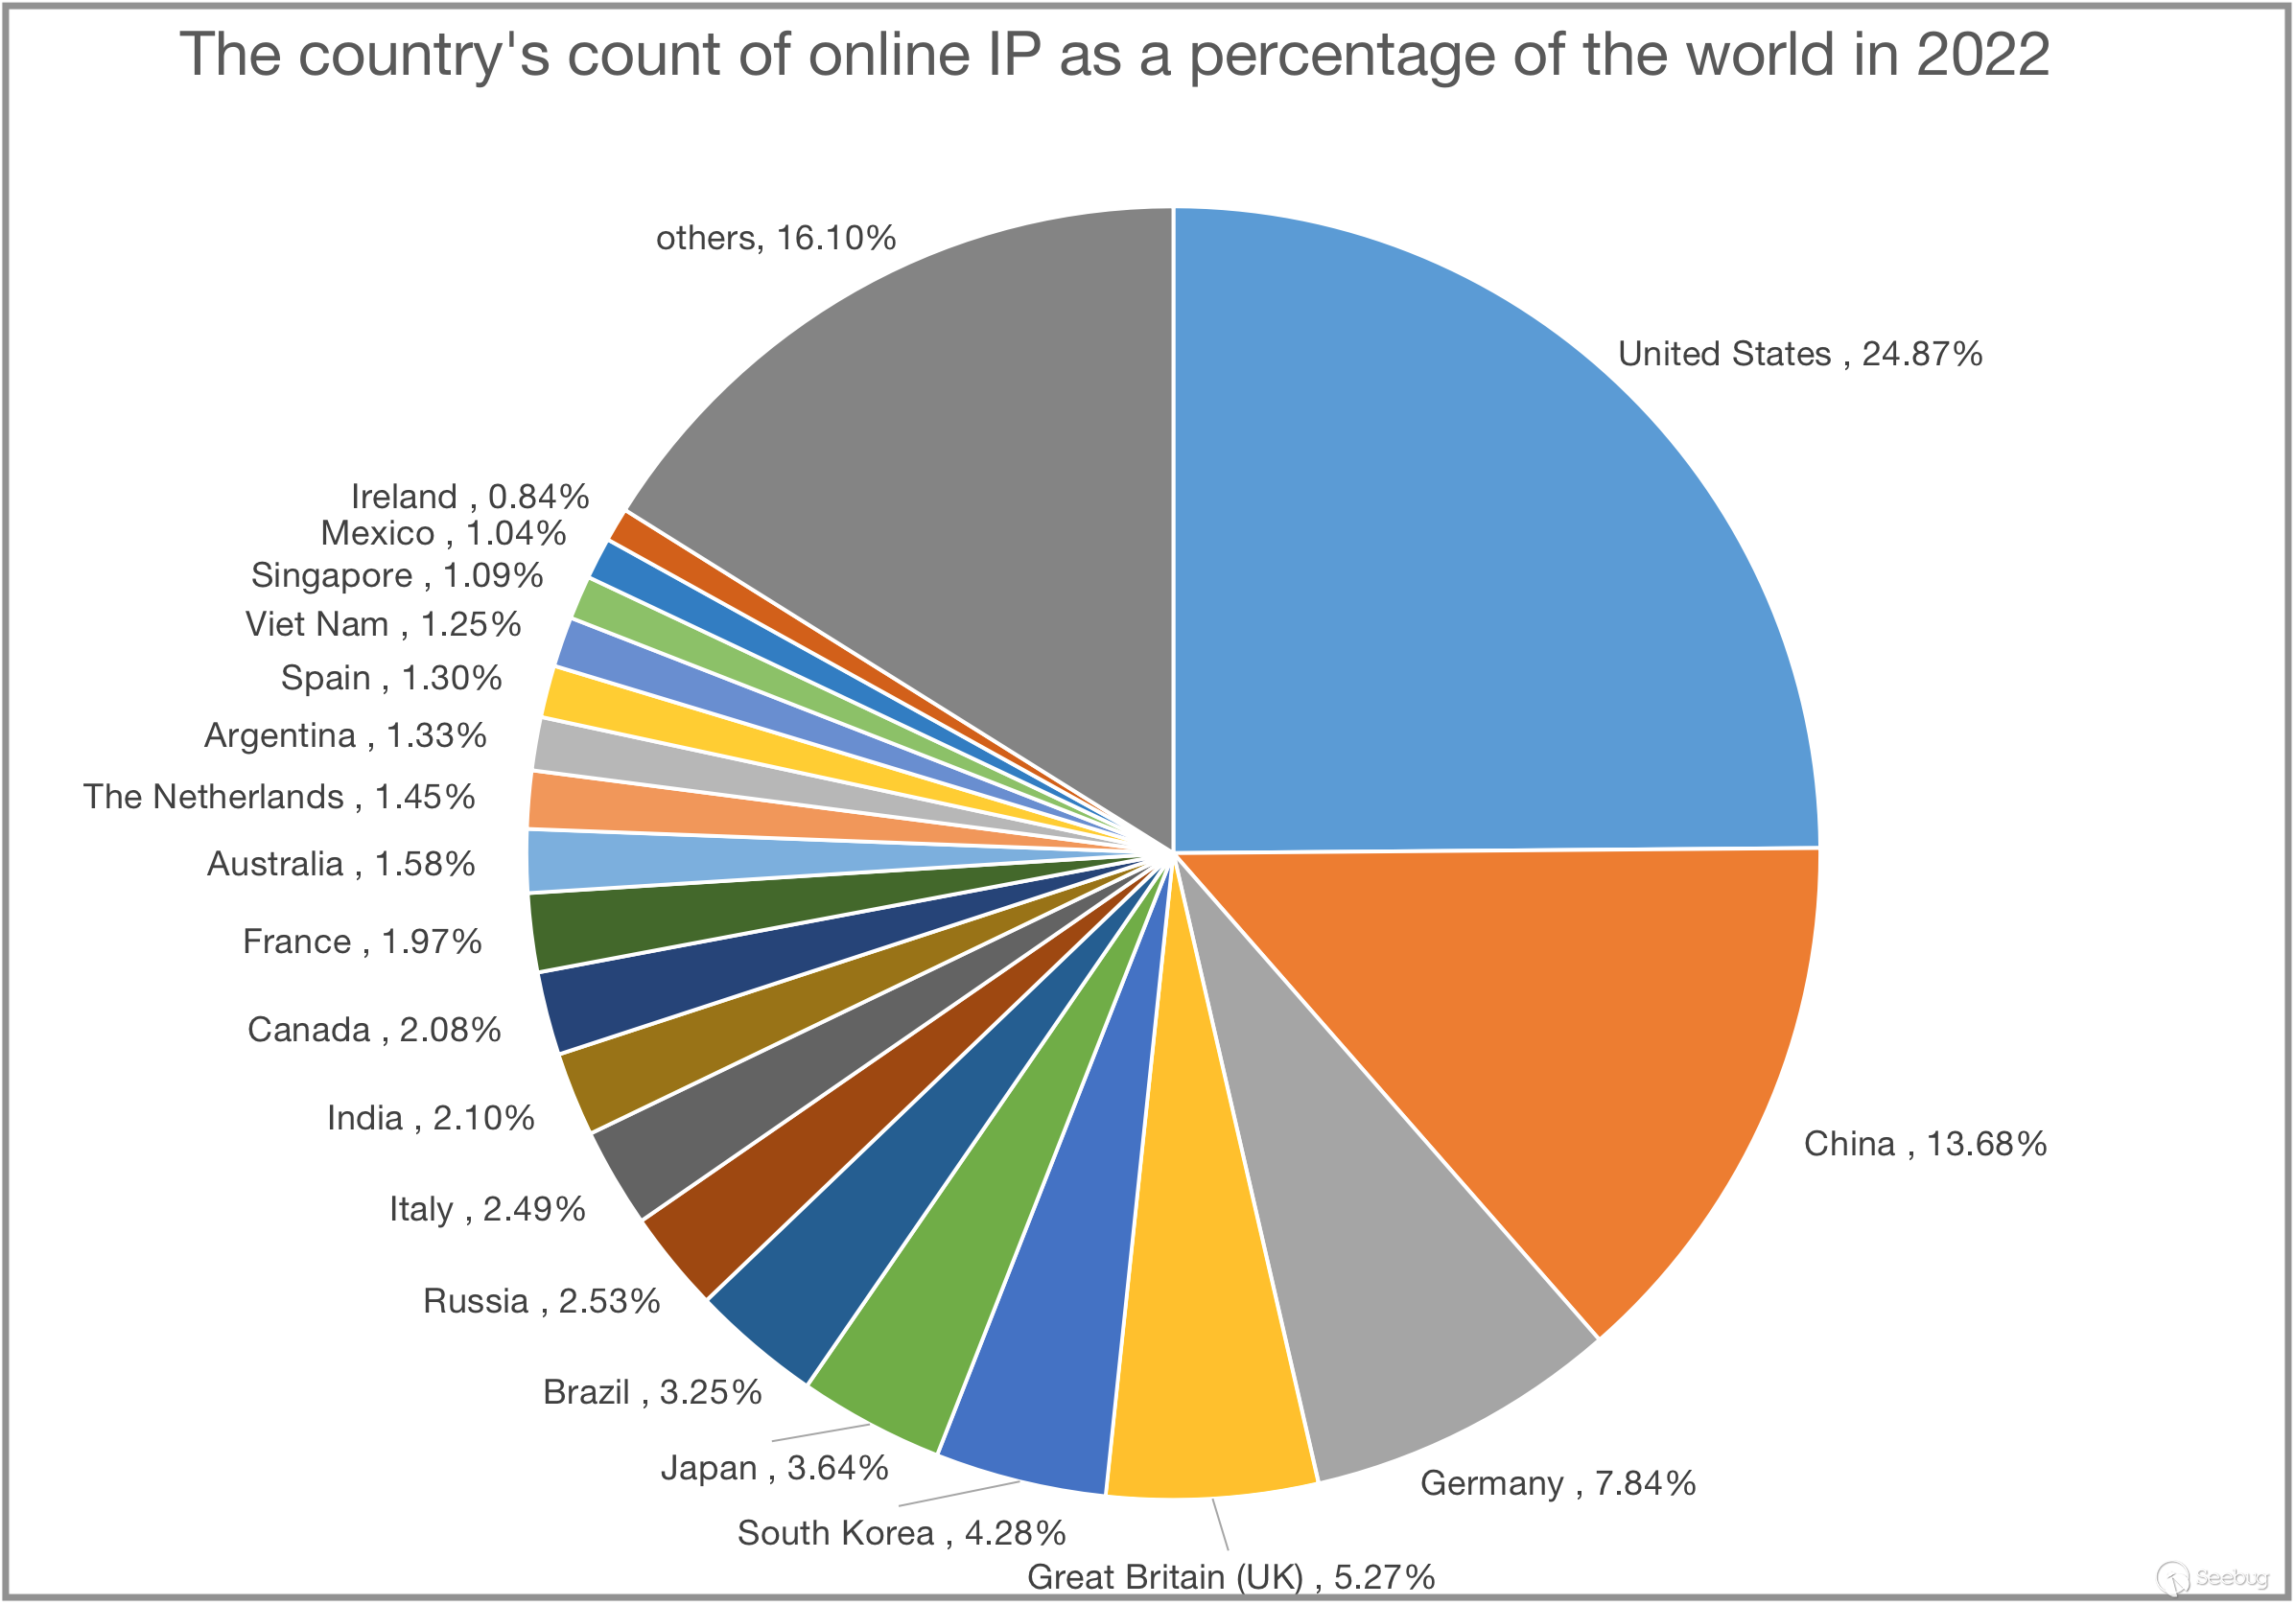
2. Online IP count by country in 2022
Based on our analysis of global online IP address statistics for the year 2022, we assessed the proportion of online IP addresses held by each country worldwide. The following chart illustrates the top twenty countries and their respective proportions of online IP addresses compared to the global total.
The cumulative proportion of the top twenty countries amounts to 83.9%, indicating that these countries collectively account for a significant majority of the global online IP addresses.
The United States holds a proportion of 24.87% of the global online IP addresses, which is close to one-fourth and secures its position as the top-ranking country worldwide. China follows closely behind with a proportion of 13.68%, firmly holding the second spot. Both the United States and China have a significant lead in terms of online IP addresses compared to other countries, as the proportions of the remaining nations are all below 10%.
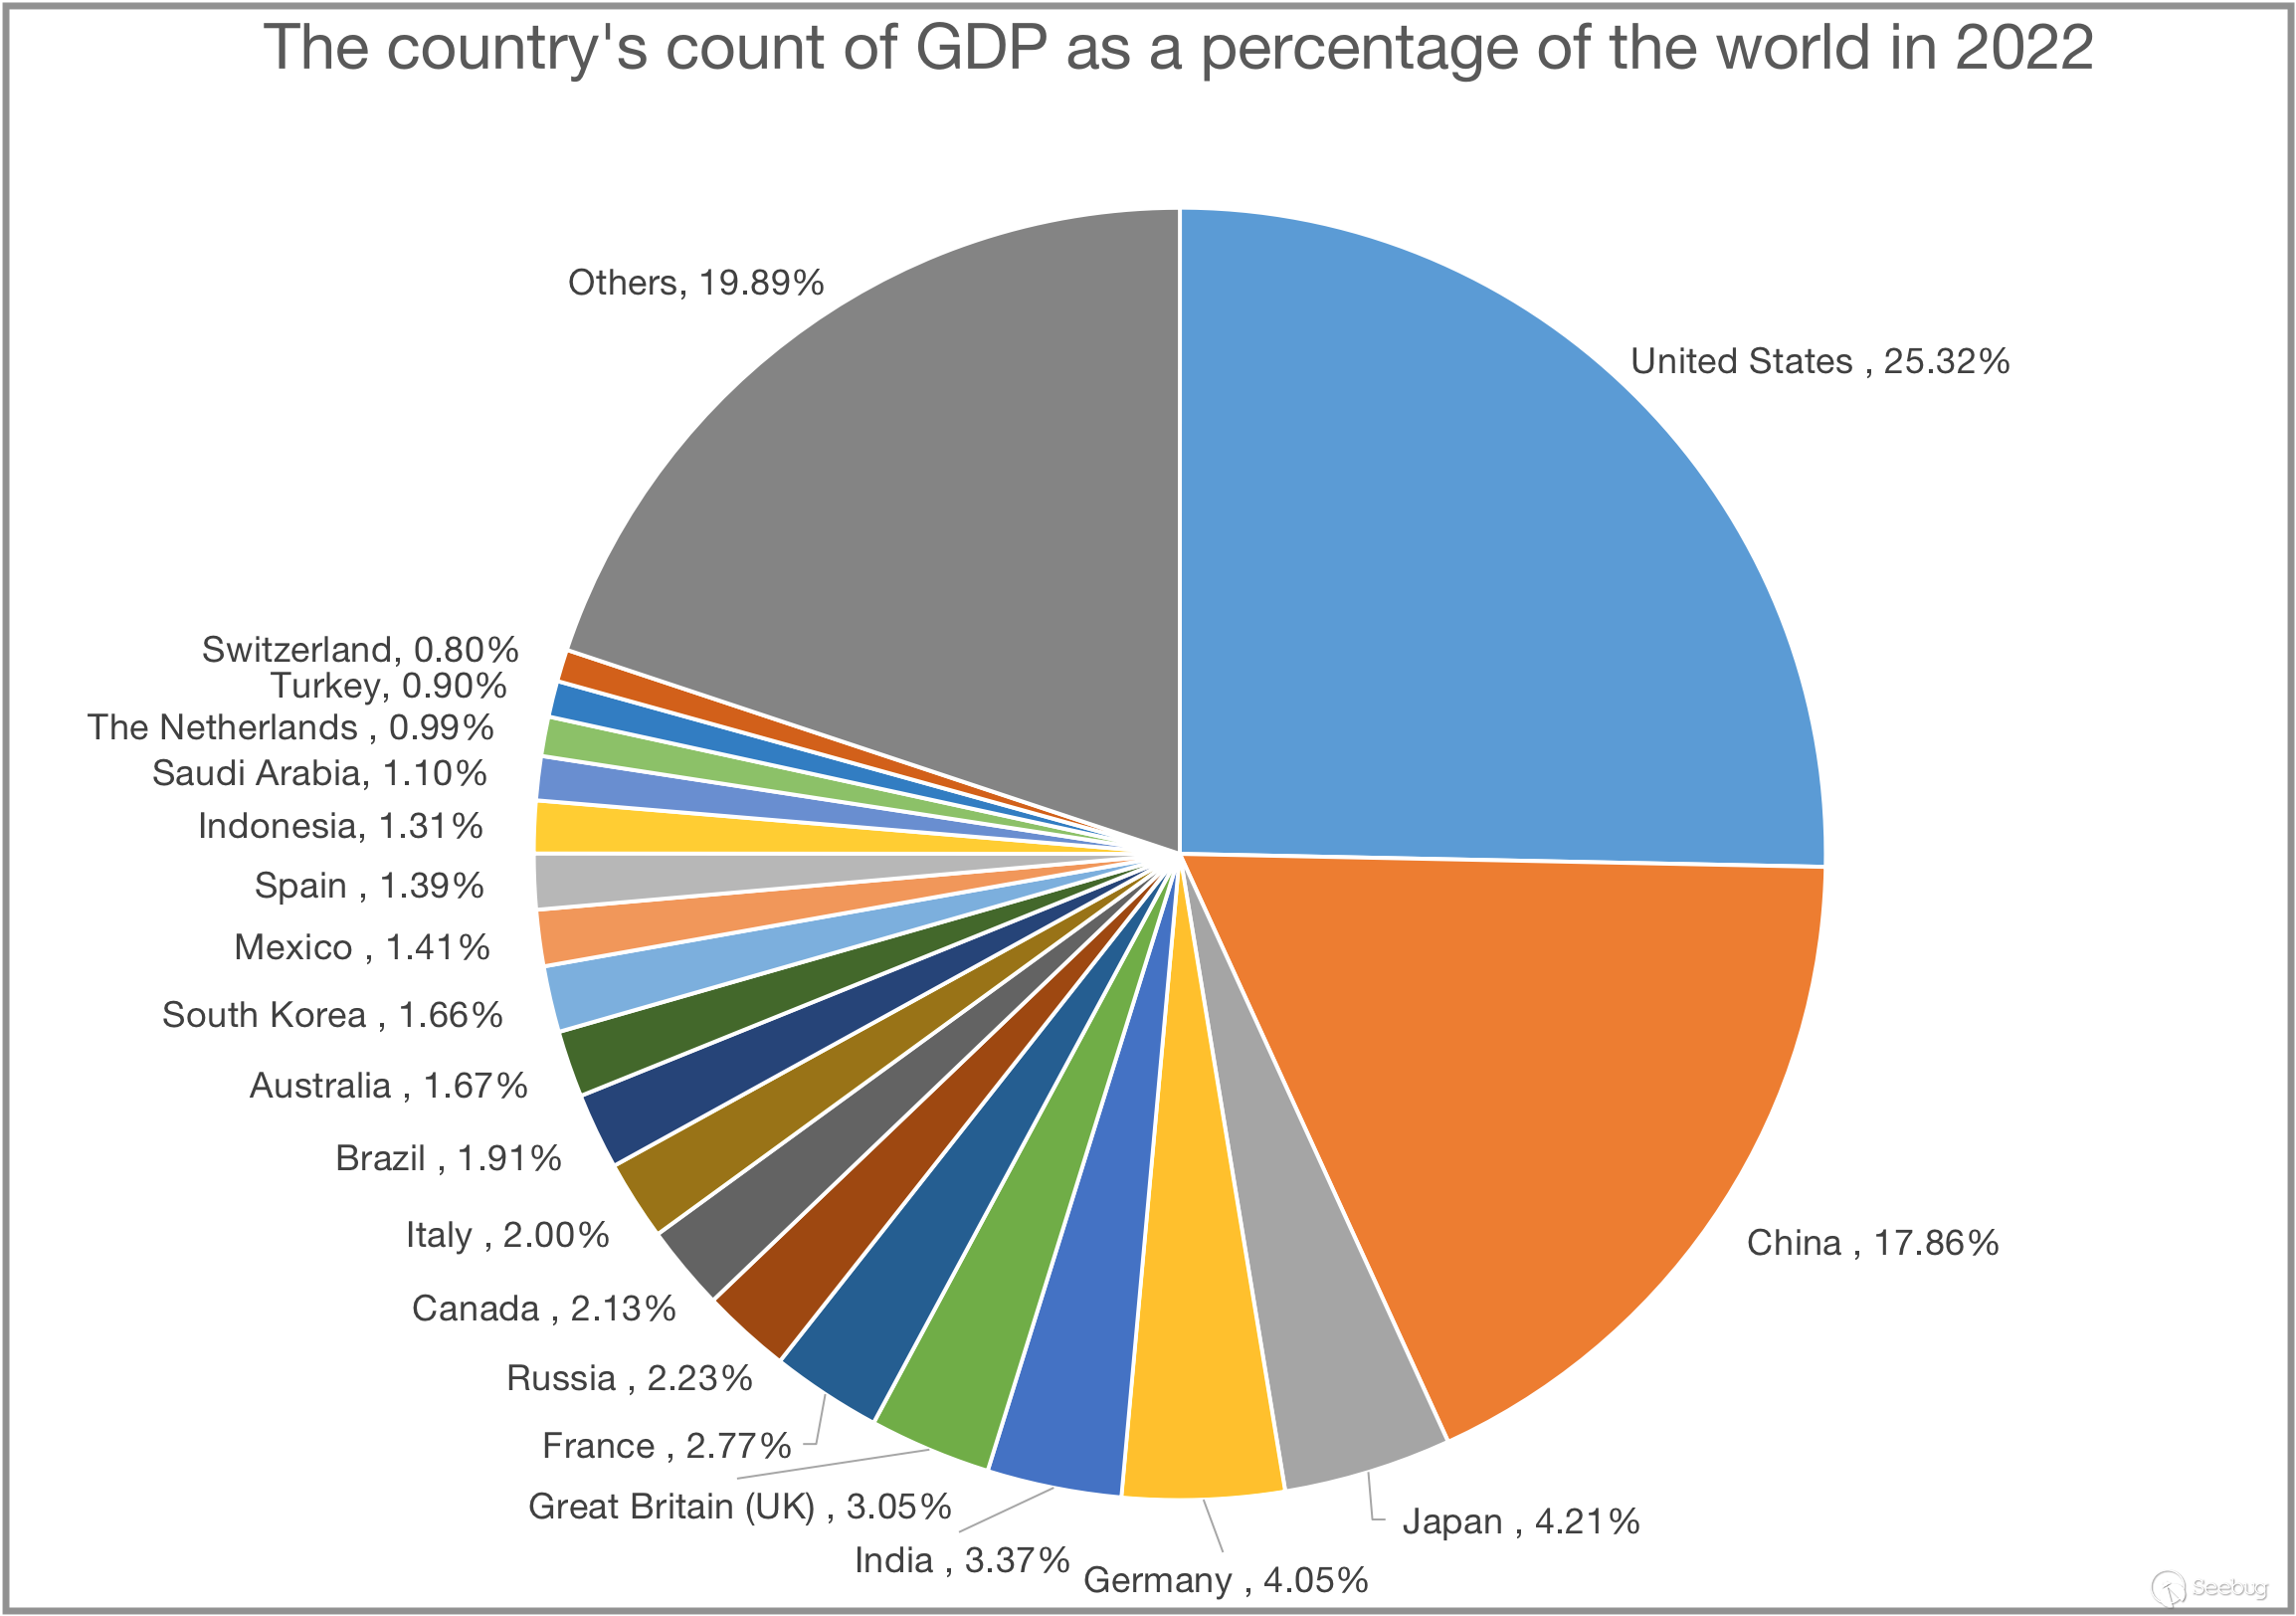
3. National GDP data for 2022
In 2022, we compiled the GDP data for countries worldwide and calculated their respective proportions in relation to the global GDP. The chart below illustrates the top twenty countries ranked by their proportion of GDP compared to the global total.
The combined proportion of these top twenty countries amounts to 80.11%, indicating that these nations collectively account for a significant majority of the global GDP. Among them, the United States holds the largest proportion at 25.32%, approximately one-fourth of the global total, securing its position as the top-ranking country. China follows closely behind with a proportion of 17.86%, firmly holding the second spot. Both the United States and China have a substantial lead in terms of GDP compared to other countries, as the proportions of the remaining nations are all below 5%.
4. Comparison of national GDP and online IP volume in 2022
We conducted a comparison of the online IP address quantities and the proportion of GDP to the global total for the top twenty countries ranked by GDP in 2022.
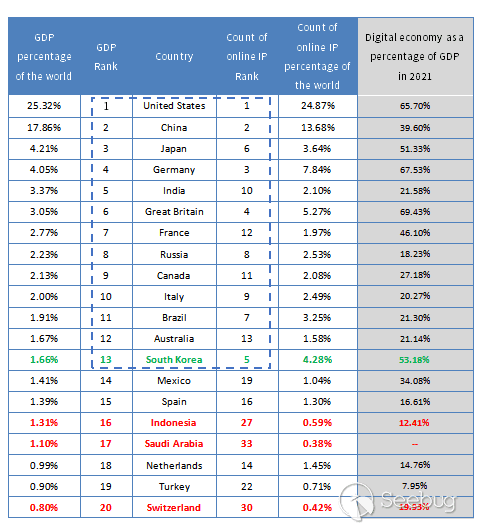
By comparing these two categories of data, we made the following observations:
-
The top 13 countries in terms of global GDP ranking also rank within the top 13 for online IP address quantity. (Highlighted by the blue dashed box in the table above.)
-
The United States' proportion of global GDP is 25.32%, while its proportion of online IP address quantity is 24.87%. These two proportions are very close, both approximately one-fourth.
-
China's proportion of global GDP is 17.86%, while its proportion of online IP address quantity is 13.68%. These two proportions are relatively close and both exceed 10%.
-
Both the United States and China have a significant lead in terms of GDP and online IP address quantity compared to other countries.
-
Among these 20 countries, we found cases where the ranking of online IP address quantity differs significantly from the GDP ranking. South Korea ranks higher in online IP address quantity than in GDP (indicated by green font in the table above), while Indonesia, Saudi Arabia, and Switzerland rank lower in online IP address quantity than in GDP (indicated by red font in the table above). We speculate that this phenomenon may be related to the composition of a country's GDP structure. Therefore, we referred to the data on the scale of the digital economy as a proportion of national GDP from the "Global Digital Economy White Paper (2022)" report published by the China Academy of Information and Communications Technology [3] for analysis (shown in the last column of gray-shaded data in the table).
Note:
The term "digital economy" refers to a novel form of economic structure driven by digitized knowledge and information as critical production elements. It leverages digital technologies as core driving forces, utilizes modern information networks as significant platforms, and integrates digital technologies with the physical economy to enhance the level of digitization, networking, and intelligence in economic and social aspects. It accelerates the reconstruction of economic development and governance models.
As of the publication of this article, the China Academy of Information and Communications Technology has not yet released the data report on the scale of the digital economy for each country in 2022. Therefore, data from 2021 is used for reference and analysis in this context.
-
The proportion of the digital economy to GDP in South Korea is 53.18%, which is relatively high and ranks 4th globally. Thus, it is consistent with the fact that South Korea has a high level of internet development, as evidenced by its higher ranking in online IP address quantity (5th) compared to its GDP ranking (13th).
-
Indonesia and Switzerland have proportions of the digital economy to GDP at 12.41% and 19.93% respectively, which are lower than those of leading developed countries. Therefore, in comparison, the internet development level in Indonesia and Switzerland is considered average, which aligns with their rankings of online IP address quantity being lower than their GDP rankings.
-
As the top-ranked GDP country in Southeast Asia, Indonesia released the "Indonesia Digital Roadmap 2021-2024" to accelerate the digital transformation in sectors such as the economy, education, finance, transportation, and healthcare, aiming to achieve inclusive development of the digital economy [3]. Although the current proportion of the digital economy to GDP in Indonesia is not high, with the rapid development of its internet and cloud computing [5], it is expected that the proportion of the digital economy will increase, and the ranking of online IP address quantity will also improve.
-
The report "Global Digital Economy White Paper (2022)" published by the China Academy of Information and Communications Technology [3] does not cover data on Saudi Arabia. Therefore, we currently do not analyze the data for Saudi Arabia.
Based on the comparison of the data above, we can conclude that there is a positive correlation between a country's online IP address quantity and its GDP scale. This correlation is also influenced by the level of internet development in each country: Countries with a higher proportion of the digital economy to GDP are likely to have a higher global ranking in terms of online IP address quantity compared to their GDP ranking, while countries with a lower proportion of the digital economy to GDP are likely to have a lower global ranking in terms of online IP address quantity compared to their GDP ranking.
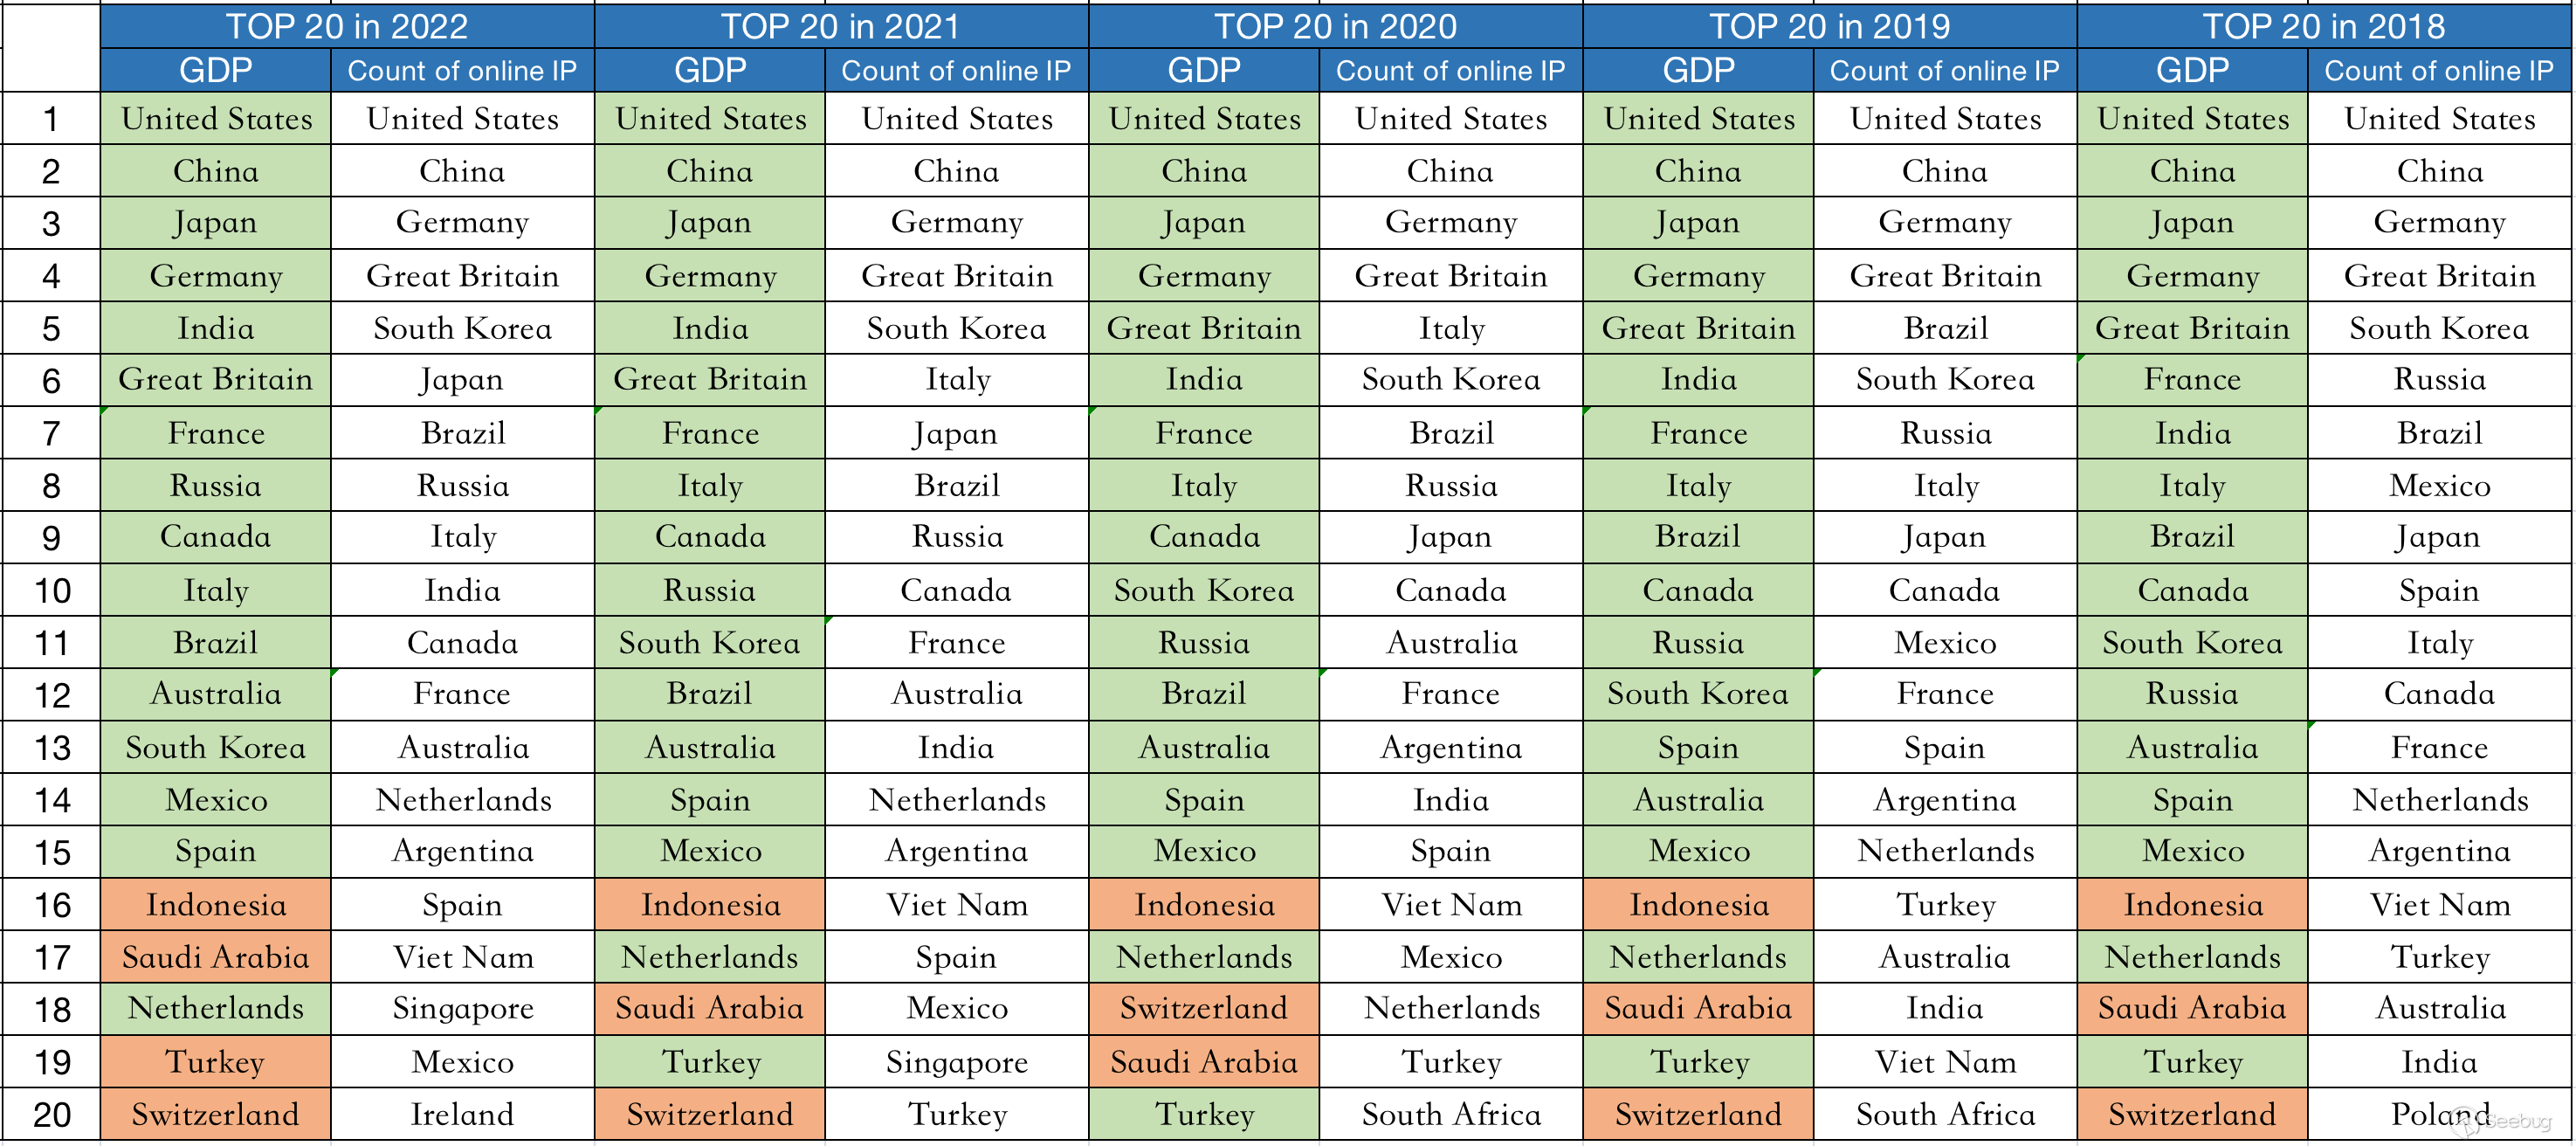
5. The top 20 countries in GDP and online IP volume in the past five years
During the past five years (2018 to 2022), we have compiled a list of the top twenty countries in terms of global GDP ranking and analyzed the top twenty countries in terms of online IP address quantity for the same period. The detailed data is presented in the table below.
We have observed whether the countries that ranked in the top twenty in terms of global GDP for each year also appeared in the top twenty for online IP address quantity. Countries highlighted with a green background indicate those that ranked in the top twenty for both GDP and online IP address quantity, while countries with an orange background indicate those that ranked in the top twenty for GDP but not for online IP address quantity.
In 2022, there were four countries that ranked in the top twenty for GDP but not for online IP address quantity globally. In 2021, 2020, 2019, and 2018, the number of such countries was three. Thus, over the past five years, around 84% of the countries that ranked in the top twenty for global GDP also appeared in the top twenty for online IP address quantity within the same year.
6. Comparison of the growth rate of national GDP and the number of online IP in the last five years
We have identified 67 countries with GDP values exceeding $100 billion in 2022 and computed their average annual GDP growth rates for the period between 2018 and 2022. Following this analysis, the top three countries in terms of ranking are Ireland, Ethiopia, and Bangladesh. Subsequently, we conducted a statistical assessment of the average annual growth rates of online IP address quantity for these 67 countries over the same five-year period and produced a corresponding ranking.
Note: Countries with relatively small absolute GDP values tend to experience significant fluctuations in GDP growth rates. Therefore, this article selects countries with GDP values exceeding $100 billion in 2022 for data collection and analysis.
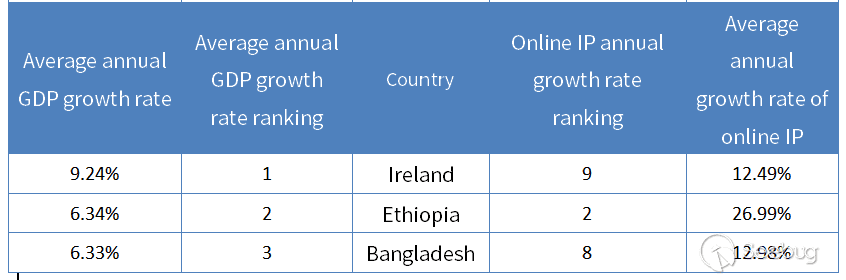
We have observed that Ireland, Ethiopia, and Bangladesh have ranked among the top three countries globally for average annual GDP growth rates during the past five years (2018-2022). Surprisingly, these countries also appear within the top 10 rankings for average annual growth rates of online IP address quantity during the same period, specifically positioned at 9th, 2nd, and 8th respectively.
Ireland, being a developed country, showcases an astonishingly high GDP growth rate. In 2021, Ireland's GDP reached 268 billion [3], accounting for 53% of its overall GDP. In comparison to other countries discussed in previous sections, Ireland's digital economy proportion to GDP is notably substantial. One of the contributing factors behind this rapid growth is Ireland's low corporate tax rates, which have led numerous multinational corporations, including tech giants like Apple and Microsoft, to establish their European headquarters in Ireland for tax optimization purposes. Additionally, Ireland has emerged as a prominent software industry hub within the entire European region [4]. These aspects significantly contribute to the country's accelerated GDP growth and the increased number of online IP addresses."
7. Conclusion
Based on the GDP data and online IP address quantity of countries worldwide over the past five years, this article compares and analyzes them based on rankings by absolute numbers, average annual growth rates, and the proportion of digital economy to GDP. It reveals a strong positive correlation between a country's online IP address quantity and its GDP scale. The growth rate of online IP addresses also exhibits a certain positive correlation with GDP growth rate.
This correlation is also influenced by the level of internet development in each country: Countries with a higher proportion of the digital economy to GDP are likely to have a higher global ranking in terms of online IP address quantity compared to their GDP ranking, while countries with a lower proportion of the digital economy to GDP are likely to have a lower global ranking in terms of online IP address quantity compared to their GDP ranking.
Network space mapping data should not be limited to the cybersecurity industry, which mainly focuses on asset discovery, vulnerability assessment, and other related needs. Instead, it has the potential to be widely applied in various industries. Just like geospatial mapping data has been extensively used across different sectors, I believe that in the near future, network space mapping data will also find broad applications in multiple industries, thereby maximizing its value.
8. Reference
[1] ZoomEye cyberspace search engine
[2] GDP values and GDP growth rate data published by the World Bank
https://databank.worldbank.org/source/world-development-indicators
-
GDP value represented in current US dollars
-
Annual percentage growth rate of GDP
[3] Global Digital Economy White Paper (2022) - China Academy of Information and Communications Technology
http://www.caict.ac.cn/kxyj/qwfb/bps/202212/P020221207397428021671.pdf
[4]From the data, we can see the power change trend of the world's major economies in the past 12 years
https://zhuanlan.zhihu.com/p/447847843
[5]Indonesia economic and trade development overview and market prospects guide
https://www.ccpit.org/a/20230504/20230504uw78.html
 本文由 Seebug Paper 发布,如需转载请注明来源。本文地址:https://paper.seebug.org/3016/