
2023-9-8 17:52:0 Author: paper.seebug.org(查看原文) 阅读量:10 收藏
Author: Knownsec 404 Team
Chinese version: https://paper.seebug.org/3024/
1. Abstract
After obtaining the mapping data in cyberspace, to analyze the data and interpret the data, and let the data speak, which is the "soul of the data" often said by the ZoomEye team, and is also the real value of the mapping in cyberspace. Cyberspace surveying and mapping data can not only be applied to the field of cyberspace to perceive the situation at the level of cyberspace, but also can be combined with the data of other industries to confirm and perceive the situation of real physical space through analysis and mining, so as to give play to its greater value.
In recent years, the ZoomEye team has conducted high-frequency mapping with a cycle of days (or even shorter) in specific areas after the occurrence of hot events. Through various data mining and analysis methods, they have discovered knowledge from different dimensions, practicing the concept of "dynamic mapping".
This article is based on the historical mapping data of the ZoomEye platform in recent years, with a monthly cycle and an extended time span from 2018 to 2022. It selects specific time periods and regions from relatively low-frequency mapping data for analysis and interpretation, embodying the concept of "dynamic mapping".
We attempt to use low-frequency mapping data to perceive and verify historical network outage events. We found that for a long-duration network interruption can be perceived and verified through low-frequency mapping data. However, short-duration network interruption caused by technical failures of network operators cannot be detected through low-frequency mapping data; only high-frequency mapping data can capture the occurrence of such events. Moreover, for network blockade events that restrict access to social networks, as there are no changes in online network assets, it is not possible to reflect the development of these events using cyberspace mapping data.
Next, we analyze the proportion of online IP addresses of selected countries (the United States, China, India, Indonesia, Ireland, and Saudi Arabia) relative to global totals, using a monthly cycle over the past five years. We observe that the count of online IP in the United States has decreased, indicating that other countries around the world have made relative progress in Internet development, narrowing the gap with the United States. China's Internet development level has remained stable with some improvement, while India's proportion has continuously increased, reflecting sustained growth in India's Internet development.
Note:In this context, "online IP" refers to IPv4 addresses that are open on the Internet, providing specific protocol services through a particular port.
Embracing the principle of "dynamic mapping," whether it be low-frequency or high-frequency mapping data, enables comprehensive analysis and interpretation to derive multidimensional insights. Low-frequency mapping data is ideal for investigating prolonged events and addressing long-spanning analytical requirements. On the other hand, high-frequency mapping data caters to post-hot-event analytical needs.
The author posits that in recent years, there has been an escalating demand for high-frequency mapping (with intervals as short as a day) and corresponding data analysis in specific regions across diverse sectors following the unfolding of hot events.
2. The practice of dynamic mapping concepts and applications
In his article "Talking about Cyberspace Mapping for Real Warfare Battlefields," heige mentioned: "As early as the Kosovo War in 1999, Steven Branigan and Bill Cheswick from Bell Labs in the United States conducted daily uninterrupted mapping of the network topology in Yugoslavia from March to early July 1999. They verified and confirmed the extent of network destruction caused by military strikes during the war through the state of IP addresses constantly disappearing or reappearing, and attempted to assess the post-war network recovery condition [2]. This is the earliest work I have seen that applies cyberspace mapping technology to mapping related to battlefields in warfare. Obviously, at that time, there was no Shodan or ZoomEye."
The ZoomEye team has applied the concept of "dynamic mapping" in multiple practical scenarios:
-
"Global Perspective: Assessing Countries' Cyber Warfare Defense Capabilities" [3]: Within the first three days after the "heartbleed" vulnerability outbreak, dynamic mapping of the global cyberspace was conducted to obtain the patching speed of vulnerabilities worldwide, reflecting countries' response capabilities in countering significant cyber threats and emergency incidents.
-
"ZoomEye Cyberspace Mapping: Impact of Venezuela Power Outage on Its Critical Infrastructure and Important Information Systems" [4]: Through dynamic mapping of the affected areas during a large-scale power outage event, the progress of the incident and its impact on critical information infrastructure were reflected.
-
"Kazakhstan Turmoil from the Perspective of Cyberspace"[5] : Extensive dynamic mapping across the entire territory of Kazakhstan was performed, observing the number of online IP addresses during network interruptions and recovery periods to perceive the outbreak and pacification of turmoil in various cities.
-
"ZoomEye Cyber Space Mapping: Unveiling the Fog of Russia-Ukraine Conflict" [6]: Dynamic mapping and analysis of network spatiotemporal data in the Ukrainian battlefield were conducted, utilizing the dynamic changes in network spatiotemporal data to reflect the evolving nature of the armed conflict. This approach also identified the characteristics of strategic, tactical, and doctrinal aspects employed by Russia through the mapping of network spatiotemporal data, including the assessment of battlefield losses.
The aforementioned practical cases represent the ZoomEye team's practice of "dynamic mapping" by conducting high-frequency mapping in specific regions following the occurrence of hot events, with a cycle ranging from days to even shorter periods. Through various data mining and analysis techniques, different dimensions of knowledge have been discovered.
However, limited mapping resources. Currently, no Cyberspace mapping platform can continuously conduct high-frequency mapping with a daily cycle throughout the global cyberspace. Therefore, can low-frequency mapping data collected on a regular basis by network space mapping platforms still be analyzed and interpreted?
In this article, based on historical mapping data from the ZoomEye platform in recent years, we adopt a monthly cycle and extend the data timeframe from 2018 to 2022. By selecting specific timeframes and regions from the relatively low-frequency mapping data, we perform analysis and interpretation.
3. Exploring global network interruption events in the security domain
Investigating historical incidents of global internet outages, caused by factors such as natural disasters, power failures, cable damages, network equipment malfunctions, deliberate interference, government regulations, and technical glitches in internet service providers. We will analyze a selection of three types of internet outages and employ low-frequency historical mapping data for confirmation.
3.1 Jammu and Kashmir, India
India is one of the countries with a high incidence of network interruption incidents worldwide. Due to political factors, Jammu and Kashmir have experienced the highest number of network interruption in India, including one prolonged event lasting for 552 days [7].
-
On August 5, 2019, the Indian government repealed Article 370 of the Indian Constitution, which granted special status and autonomy to Jammu and Kashmir state. This immediately sparked large-scale protests in Kashmir, prompting the Indian government to initiate a network shutdown and deploy a significant number of security forces [8] [9].
-
On January 25, 2020, the state reinstated 2G services, implementing a restrictive policy allowing access only to around 300 websites included in a whitelist [7] [10].
-
The network blockade persisted until February 6, 2021, when all communication services, including 4G, were fully restored [7] [9].
During the period from January 2019 to December 2021, the trend of online IP counts in Jammu and Kashmir state, India, is depicted in the provided graph. Upon analysis, the following observations were made:
-
In August 2019, the number of online IP addresses in that region sharply declined, and from September to December 2019, there were zero online IP addresses for four consecutive months. This trend aligns with the timing of the Indian government's network interruption in that region on August 5th.
-
During the period from January 2020 to February 2021, the number of online IP addresses in that region was no longer zero and showed a partial recovery. However, it did not reach the level of online IP addresses before the internet shutdown event. This is because starting from January 2020, although partial network restoration took place in that region, network access remained restricted by a whitelist.
-
Starting from March 2021, the number of online IP addresses in that region experienced a sharp increase and reached the level of online IP addresses before the network interruption. This indicates that the network blockade in that region has ended, and normal network communication services have been restored.
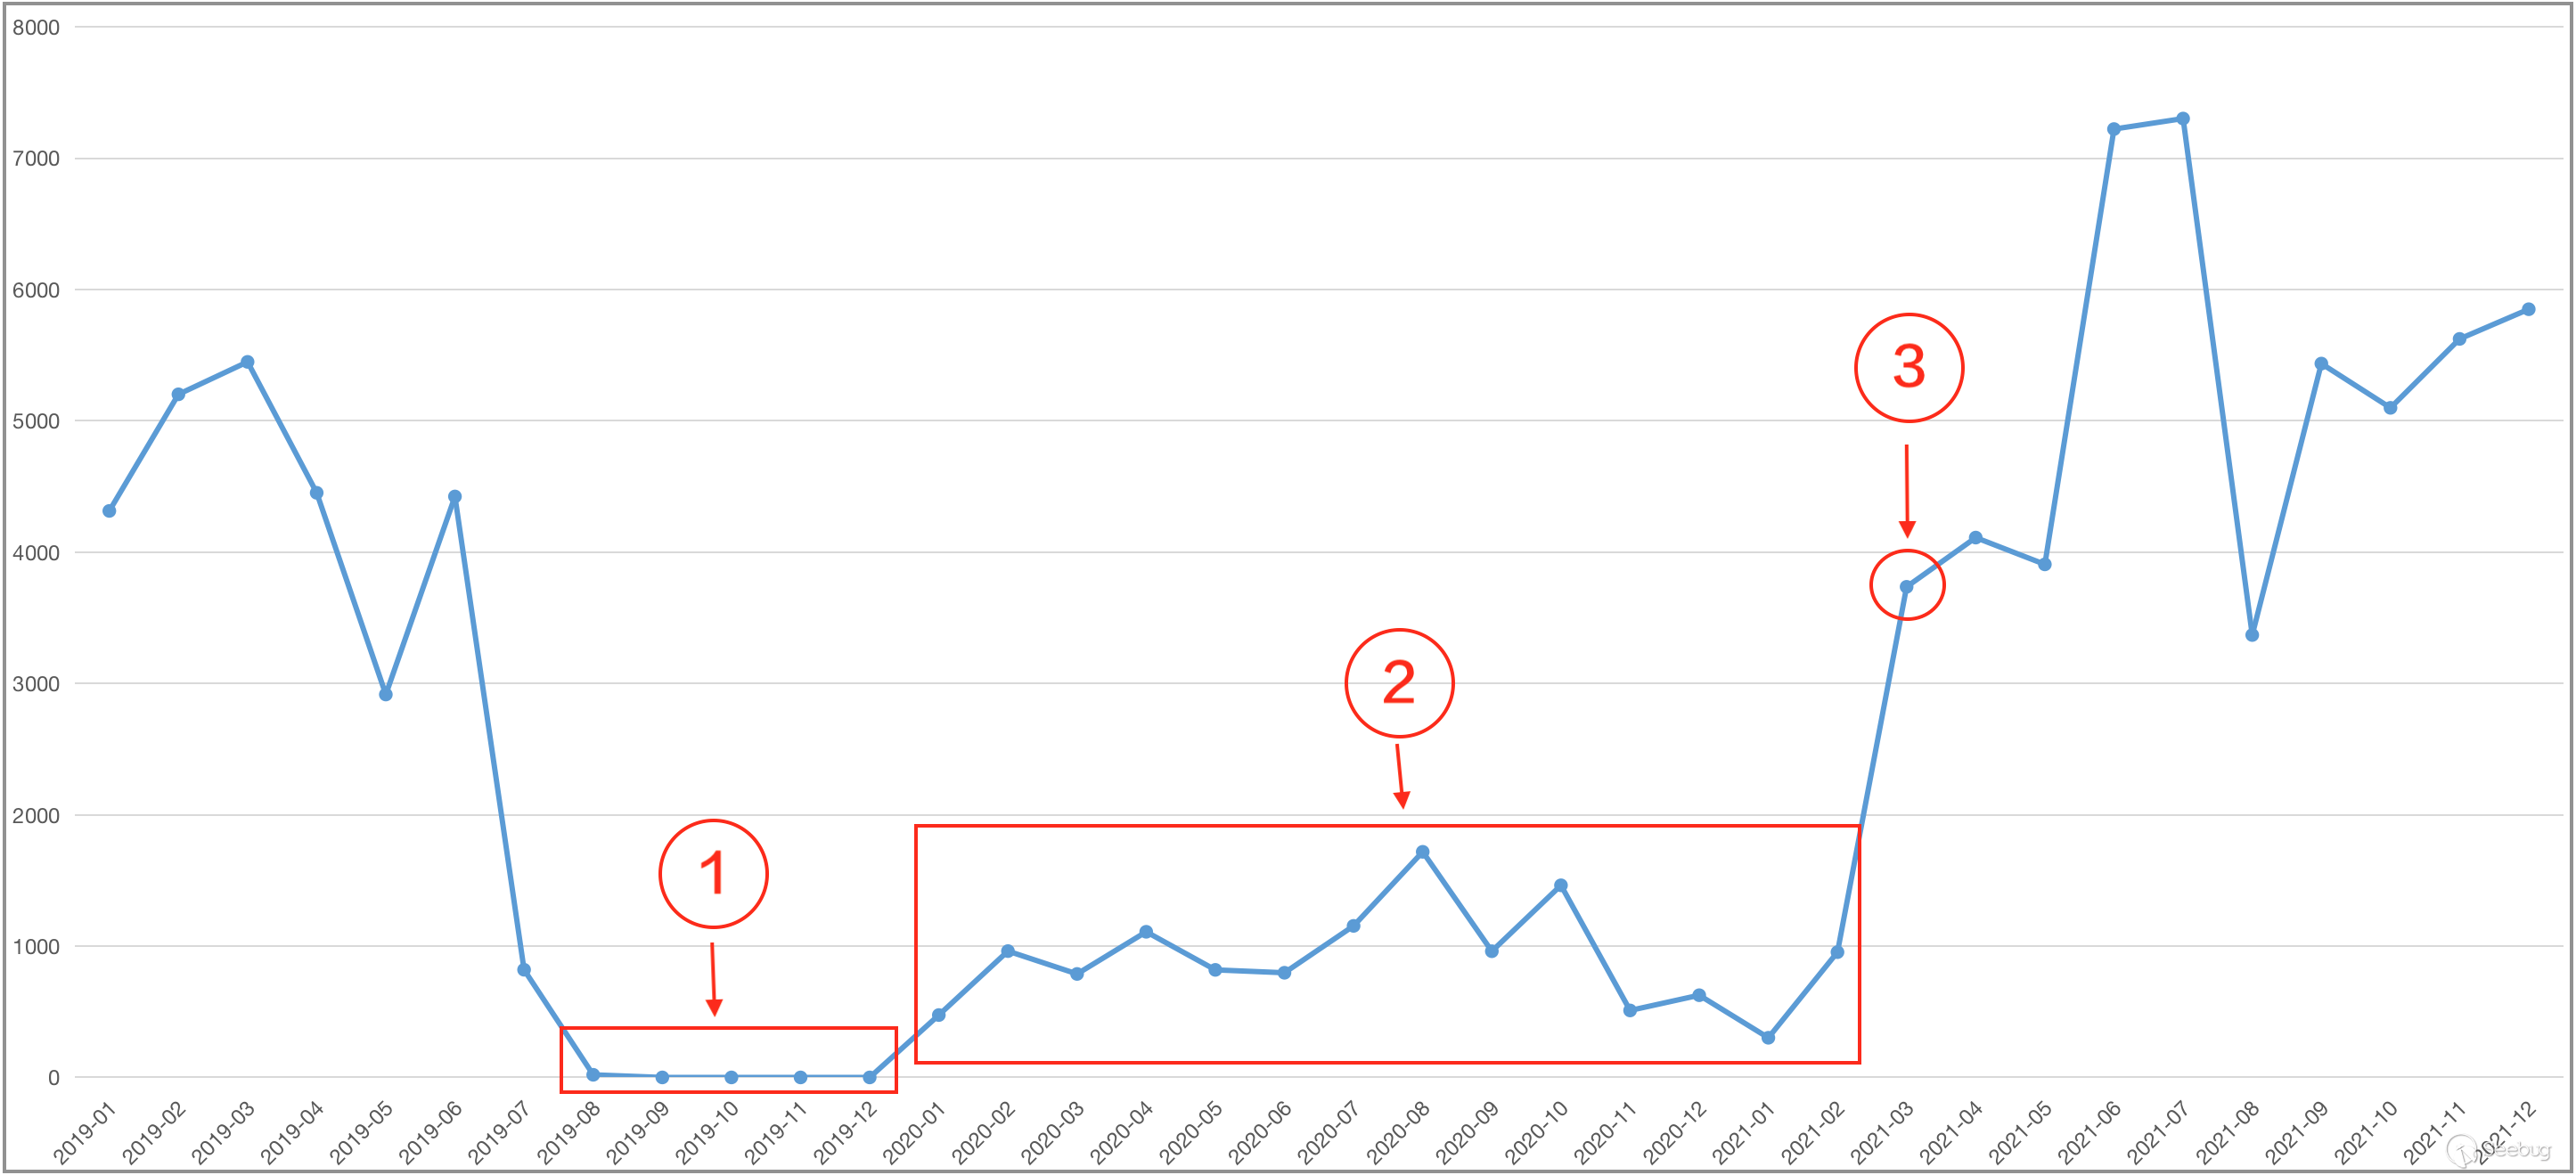
Note:Number 1 refer to Online IP count reaches zero;Number 2 refer to Online IP count recovers but remains below pre-disconnection levels;Number 3 refer to Online IP count fully recovers to pre-disconnection levels
3.2 Chad
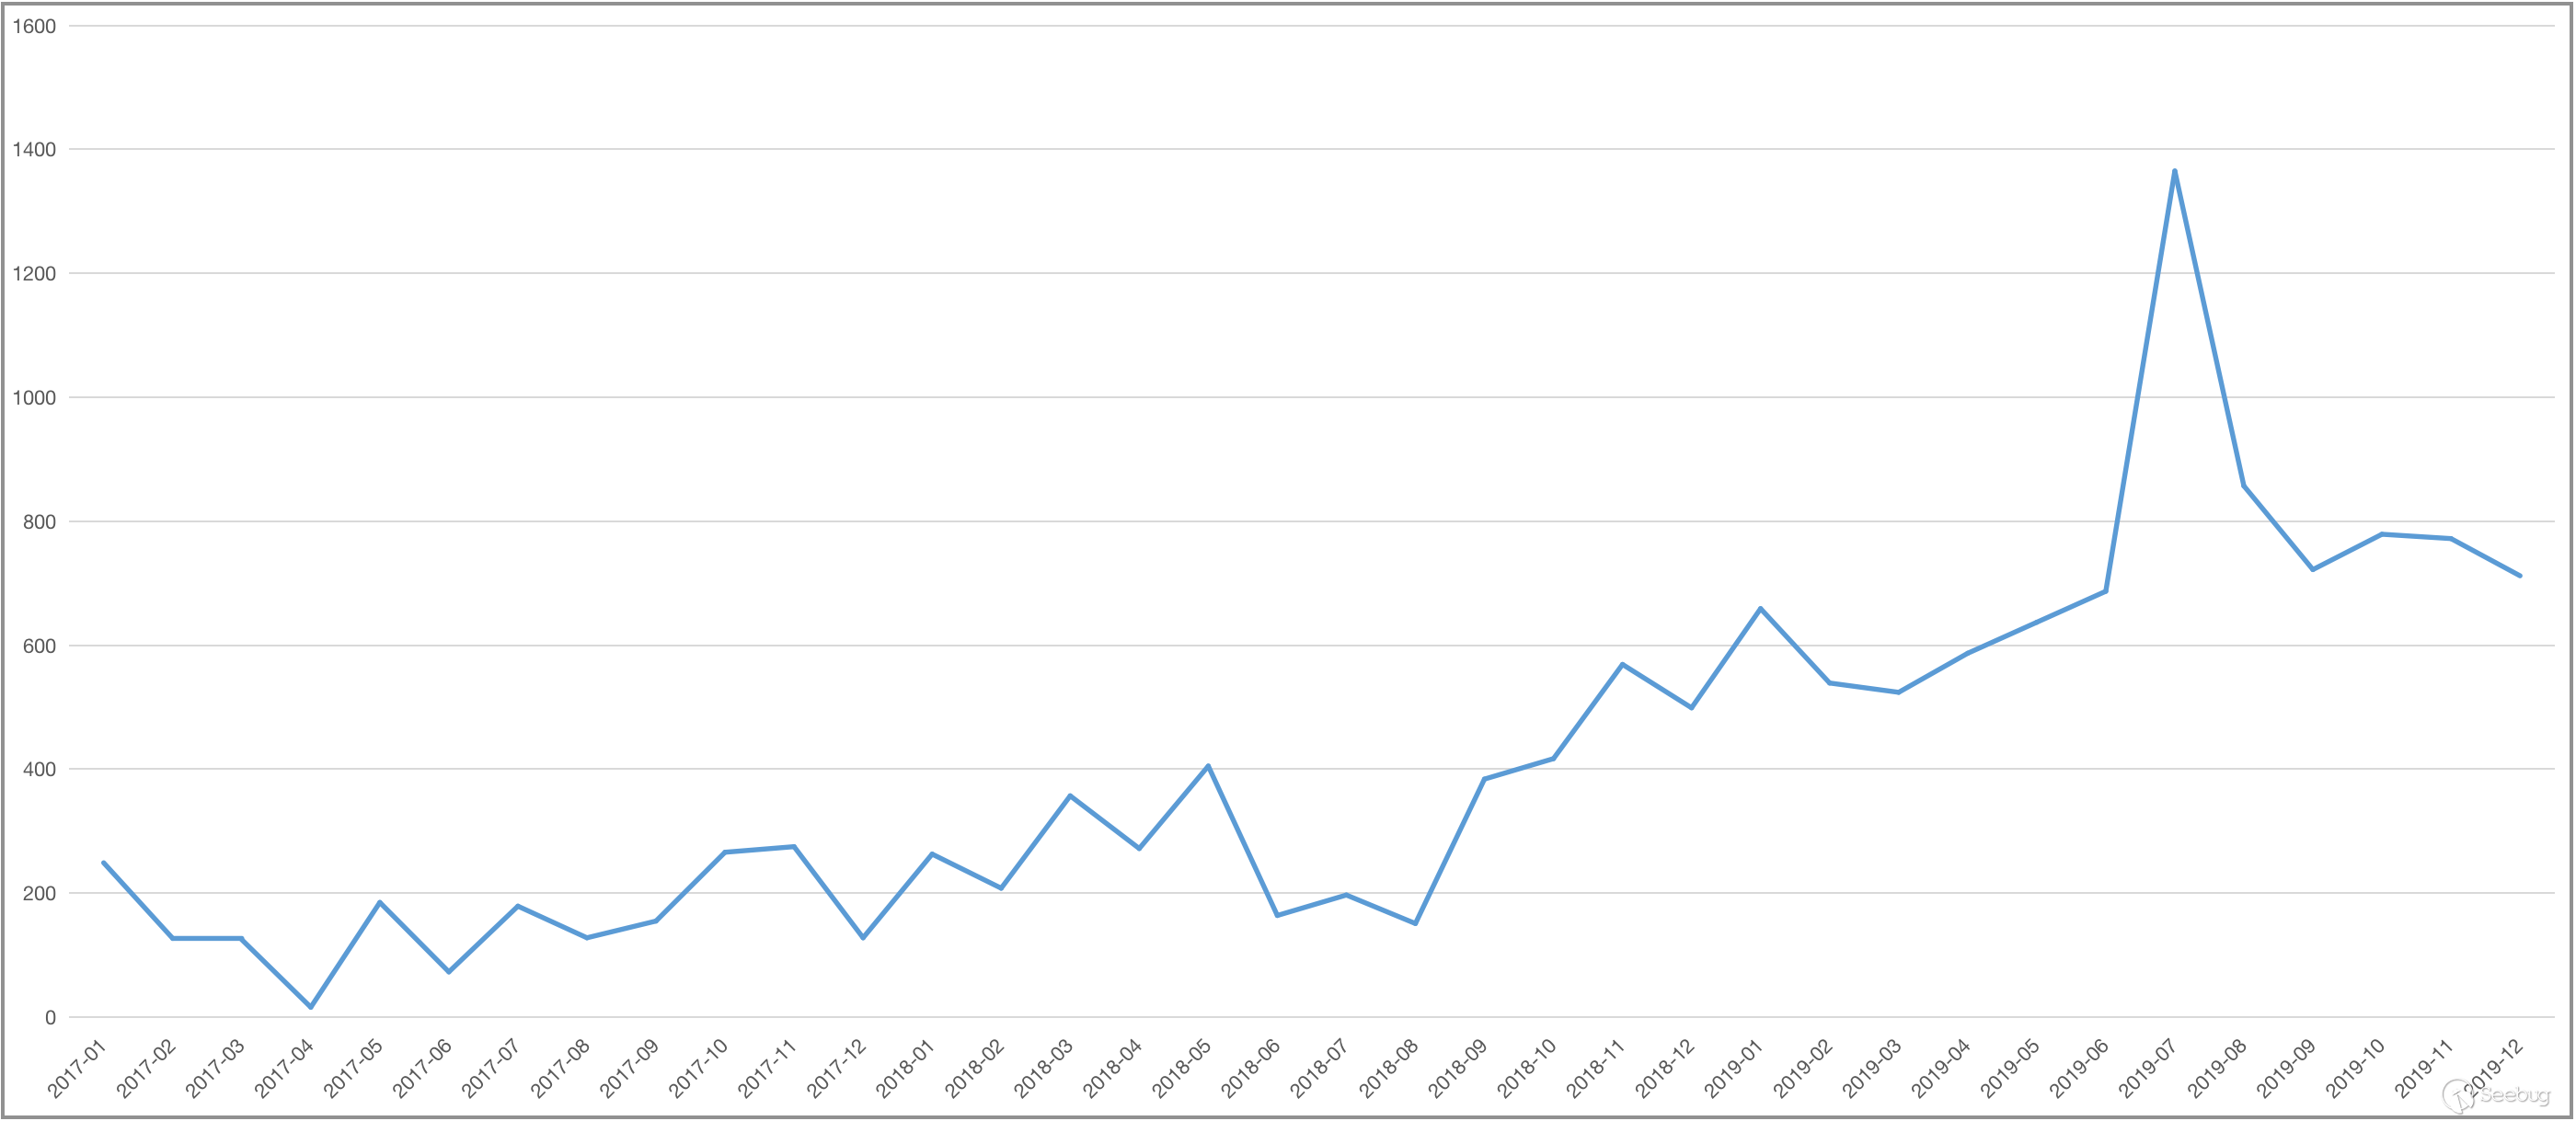
Chad is a landlocked country in central Africa. From March 2018 to July 2019, the government blocked access to social networks such as Facebook, Twitter, WhatsApp, Instagram, and YouTube, lasting for 16 months [11].
Analyzing the trend of online IP counts in Chad from January 2017 to December 2019, it was observed that the number of online IPs did not decrease during the 16-month blackout period but showed a gradual increase.
This indicates that for internet blackout incidents targeting social network interruption ,where there is no change in online network assets, network space mapping data cannot reflect the progression of these events.
3.3 Short-term network interruption Caused by Technical Faults
Across history, numerous countries have witnessed network interruption triggered by technical faults from internet service providers (ISPs). Notable incidents include the 2019 Australia network interruptions event [12] and the extensive regional network interruptions in the United Kingdom in 2020 [13]. ISPs have successfully rectified these technical issues within a relatively brief timeframe, typically a few hours.
During such network interruption events, the impacted duration is limited to a few hours, making it imperceptible through low-frequency mapping data that operates on a monthly cycle. Consequently, short-lived network interruption resulting from technical faults cannot be captured by low-frequency mapping data. Only high-frequency mapping data can effectively monitor the occurrence of such incidents.
4. National-level Dynamic Mapping Data Analysis
In this section, we analyze the proportion of a country's online IP counts to the global online IP counts on a monthly basis. We select several countries and examine the trends in their proportion of online IP counts to the global total over the past five years.
Note: ZoomEye, the cyberspace search engine, randomly performs mapping on global IP addresses, which may result in sudden data fluctuations (increase or decrease) for a specific country in a given month. In this section, we do not focus on individual monthly data fluctuations or absolute quantities. Instead, we analyze the overall trend in the proportion of a country's online IP counts to the global total over the past five years.
4.1 Top Twenty Countries
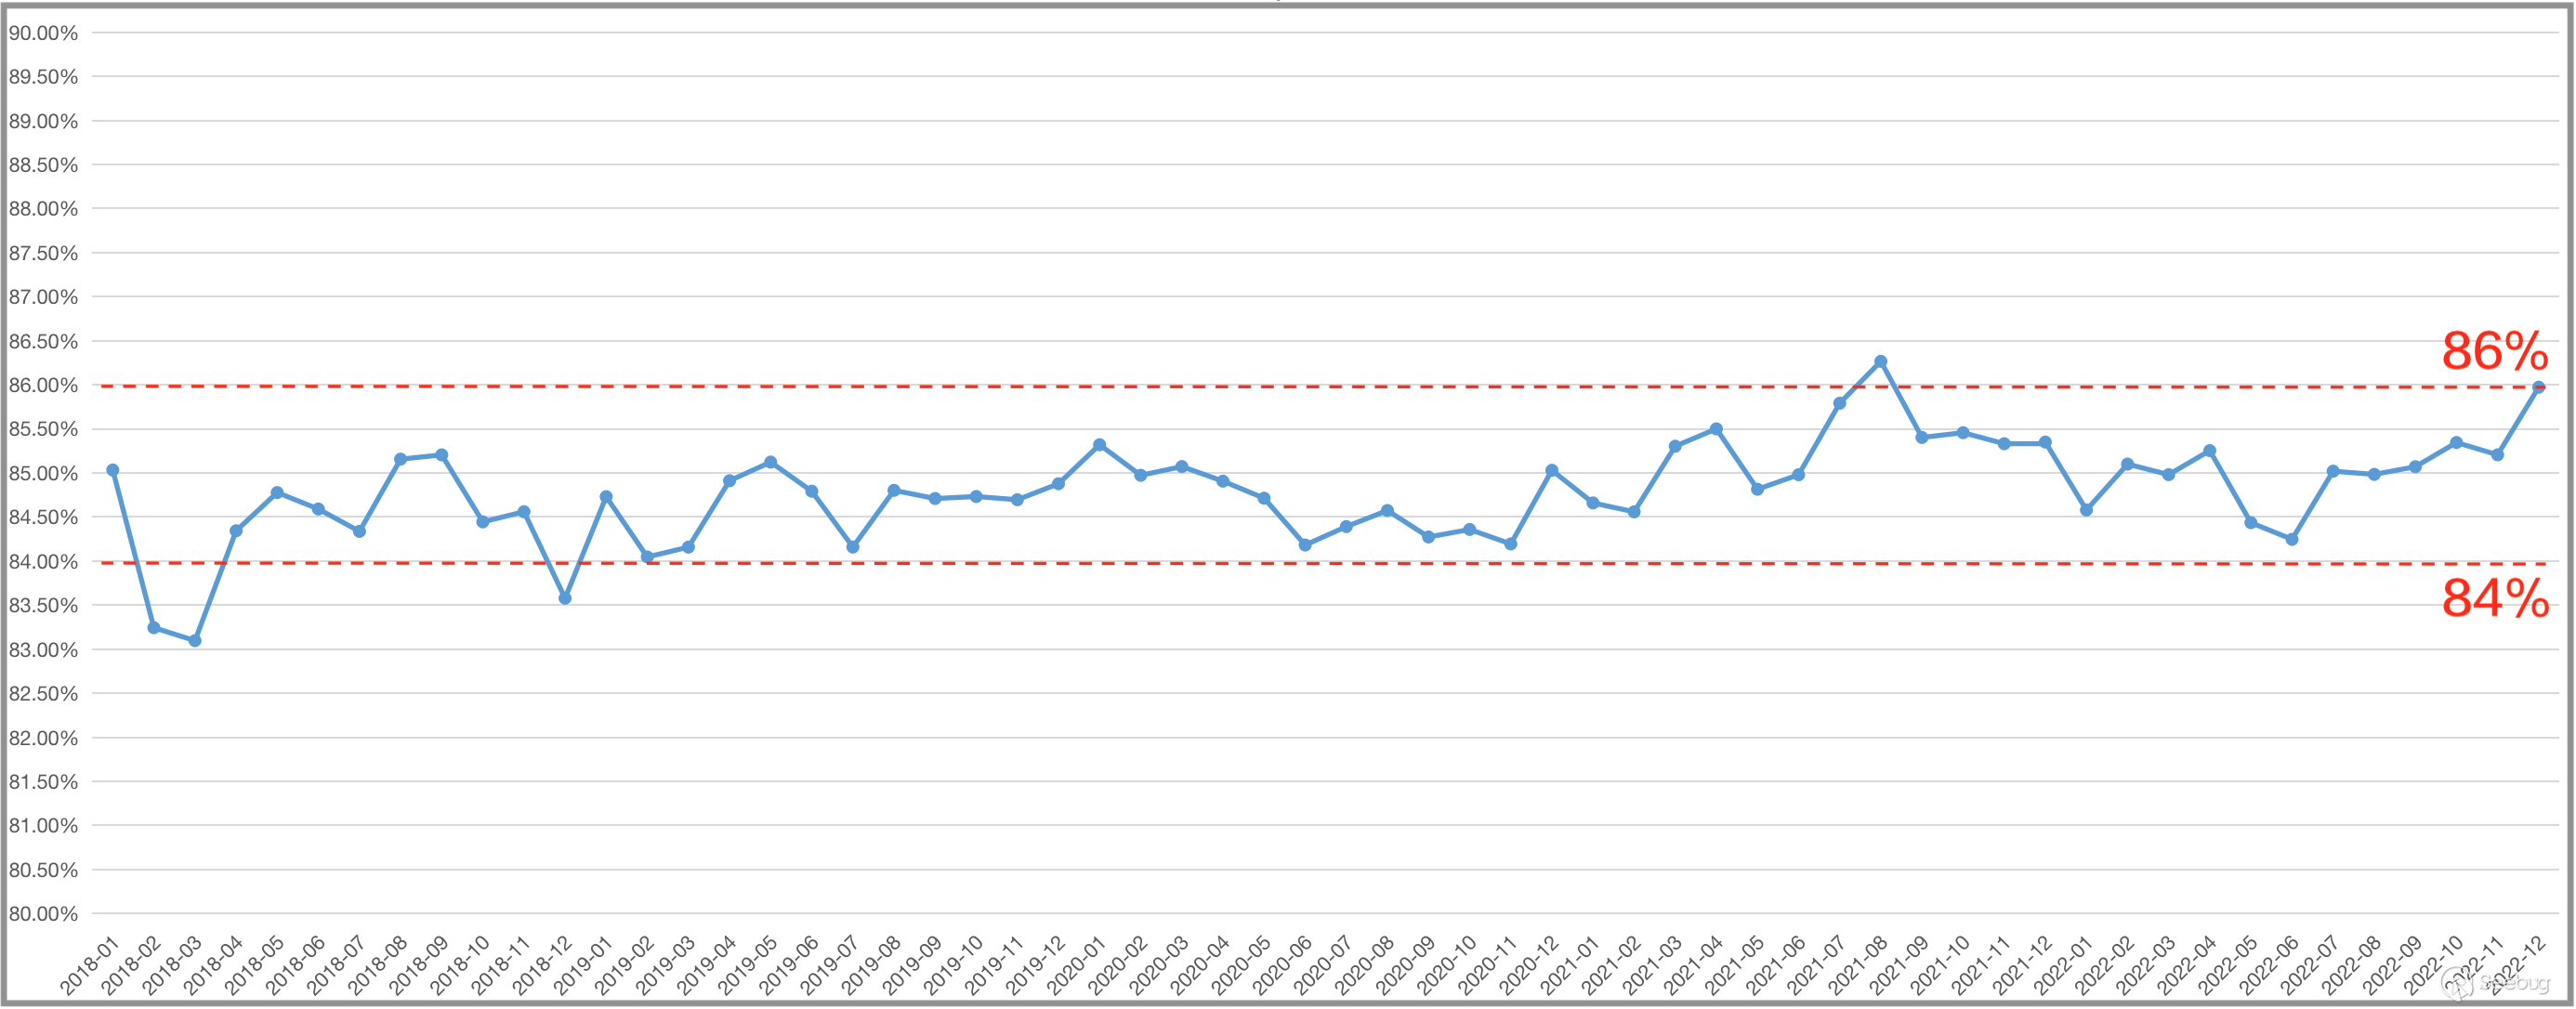
We choose the top twenty countries with the highest global online IP counts in 2022 and calculate the sum of their proportions to the global total. The trend is displayed in the following graph.
Note: The top twenty countries with the highest global online IP counts in 2022 are: United States, China, Germany, United Kingdom, South Korea, Japan, Brazil, Russia, Italy, India, Canada, France, Australia, Netherlands, Argentina, Spain, Vietnam, Singapore, Mexico, and Ireland.
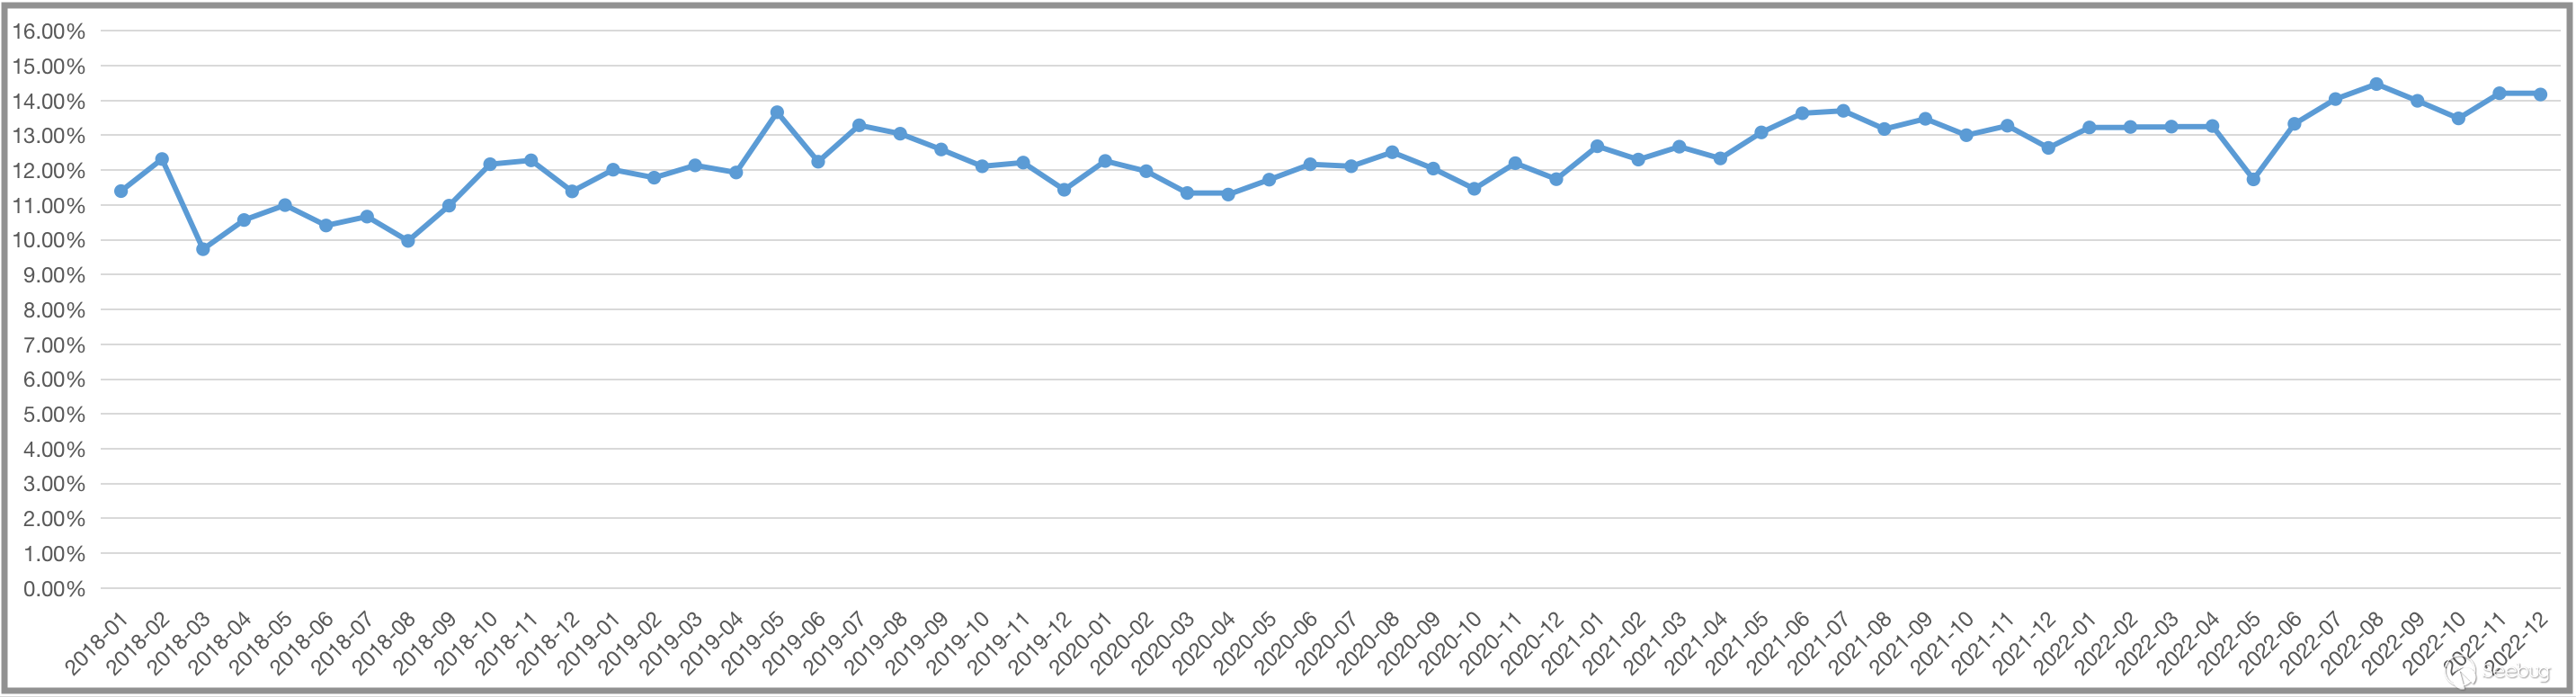
Over the past five years, the sum of online IP counts for these twenty countries to the global total has mostly remained within the range of 84% to 86%. Overall, this proportion data is stable. This indicates that the gap in internet development between the leading countries and others has remained relatively unchanged during these five years.
4.2 United States
As a global superpower, the United States demonstrates the following trend in the proportion of its online IP counts to the global total.
Over the past five years, the proportion of online IP counts for the United States has fluctuated between 25% and 37%, consistently ranking first among all countries worldwide. This value provides an intuitive reflection of the United States' higher level of internet development compared to other countries globally.
By observing the trend, we find that from January 2018 to August 2019, the proportion of online IP counts for the United States consistently exceeded 30%. From September 2019 to December 2022, it remained below 30%. This trend does not signify a decline in the United States' internet development level but rather indicates that, comparatively, other countries' internet development levels have been improving, narrowing the gap with the United States.
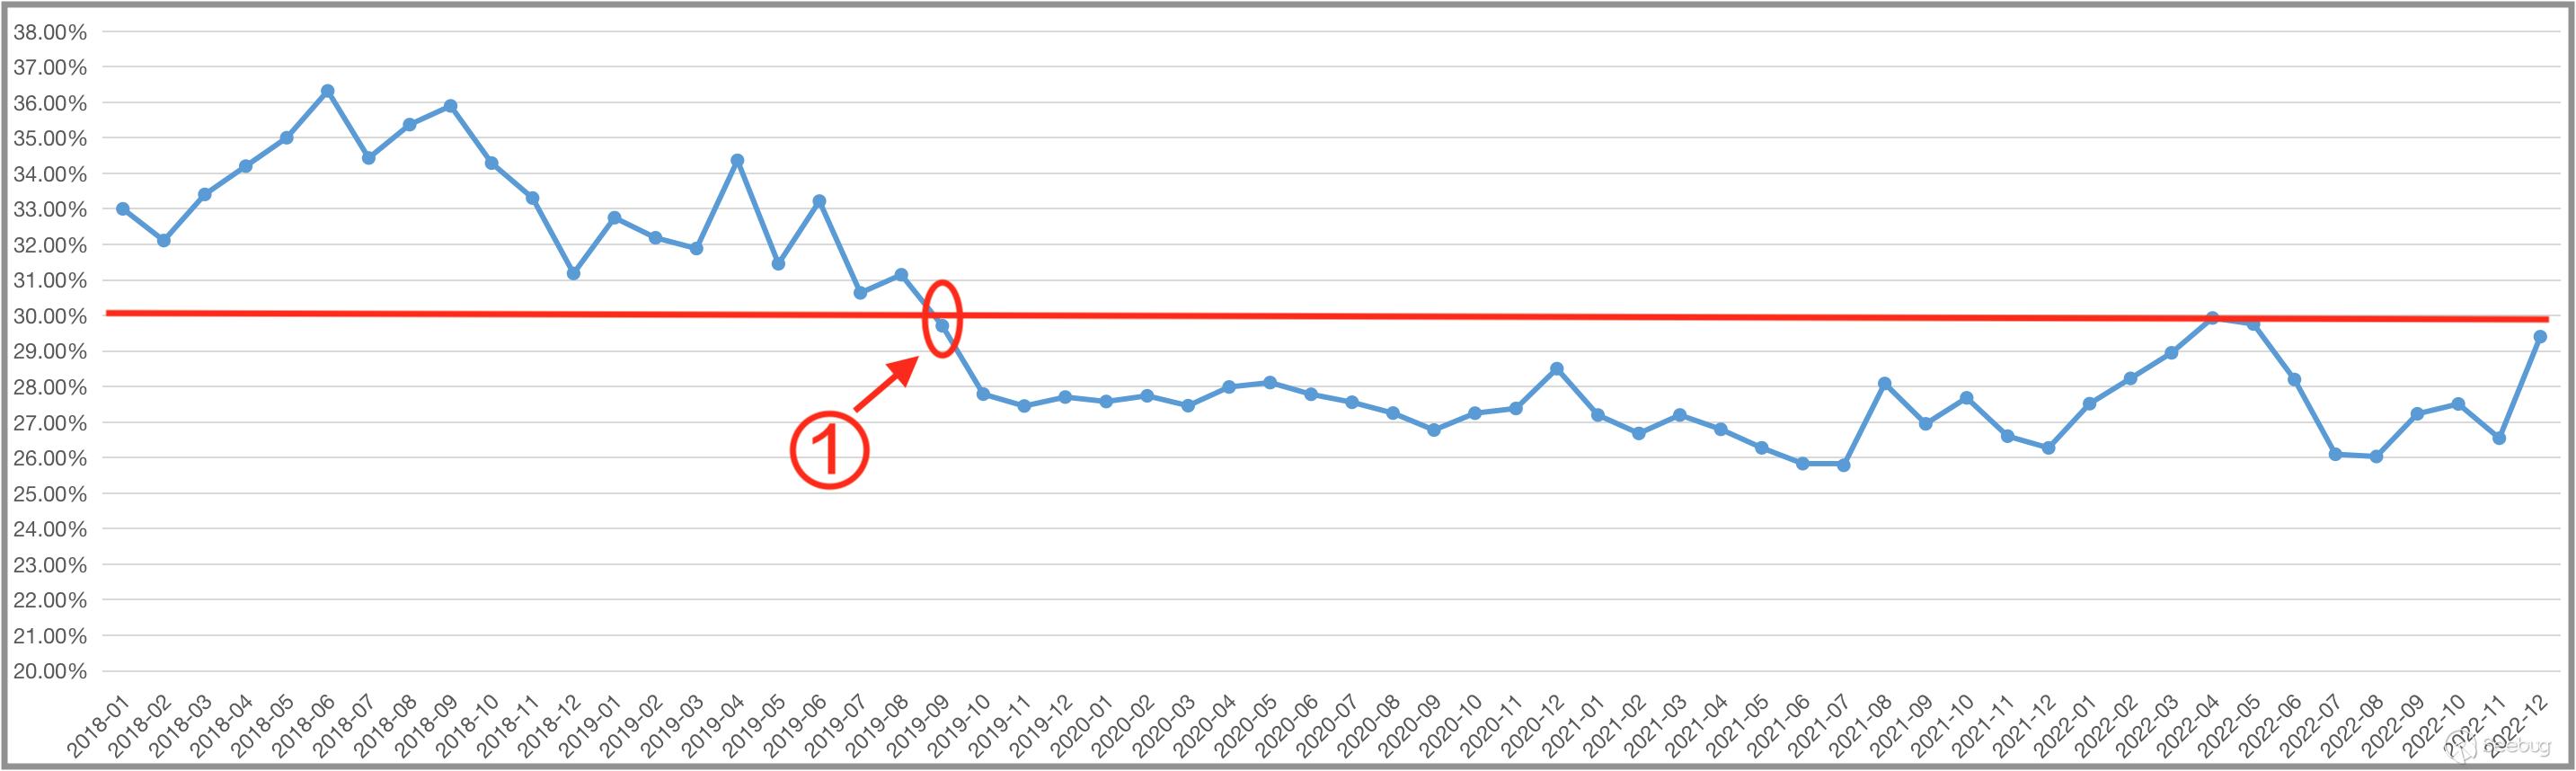
Note:Number 1 refer to From January 2018 to August 2019, the proportion remained above 30%.From September 2019 to December 2022, the proportion remained below 30%.
4.3 China
As the world's second-largest economy, China exhibits the following trend in the proportion of its online IP counts to the global total.
Over the past five years, the proportion of online IP counts for China has ranged from 9% to 15%, consistently ranking second among all countries globally, behind the United States.
By observing the trend, we find that over the past five years, the proportion of online IP counts for China has remained relatively stable with a slight increase. This indicates steady growth in China's internet development level.
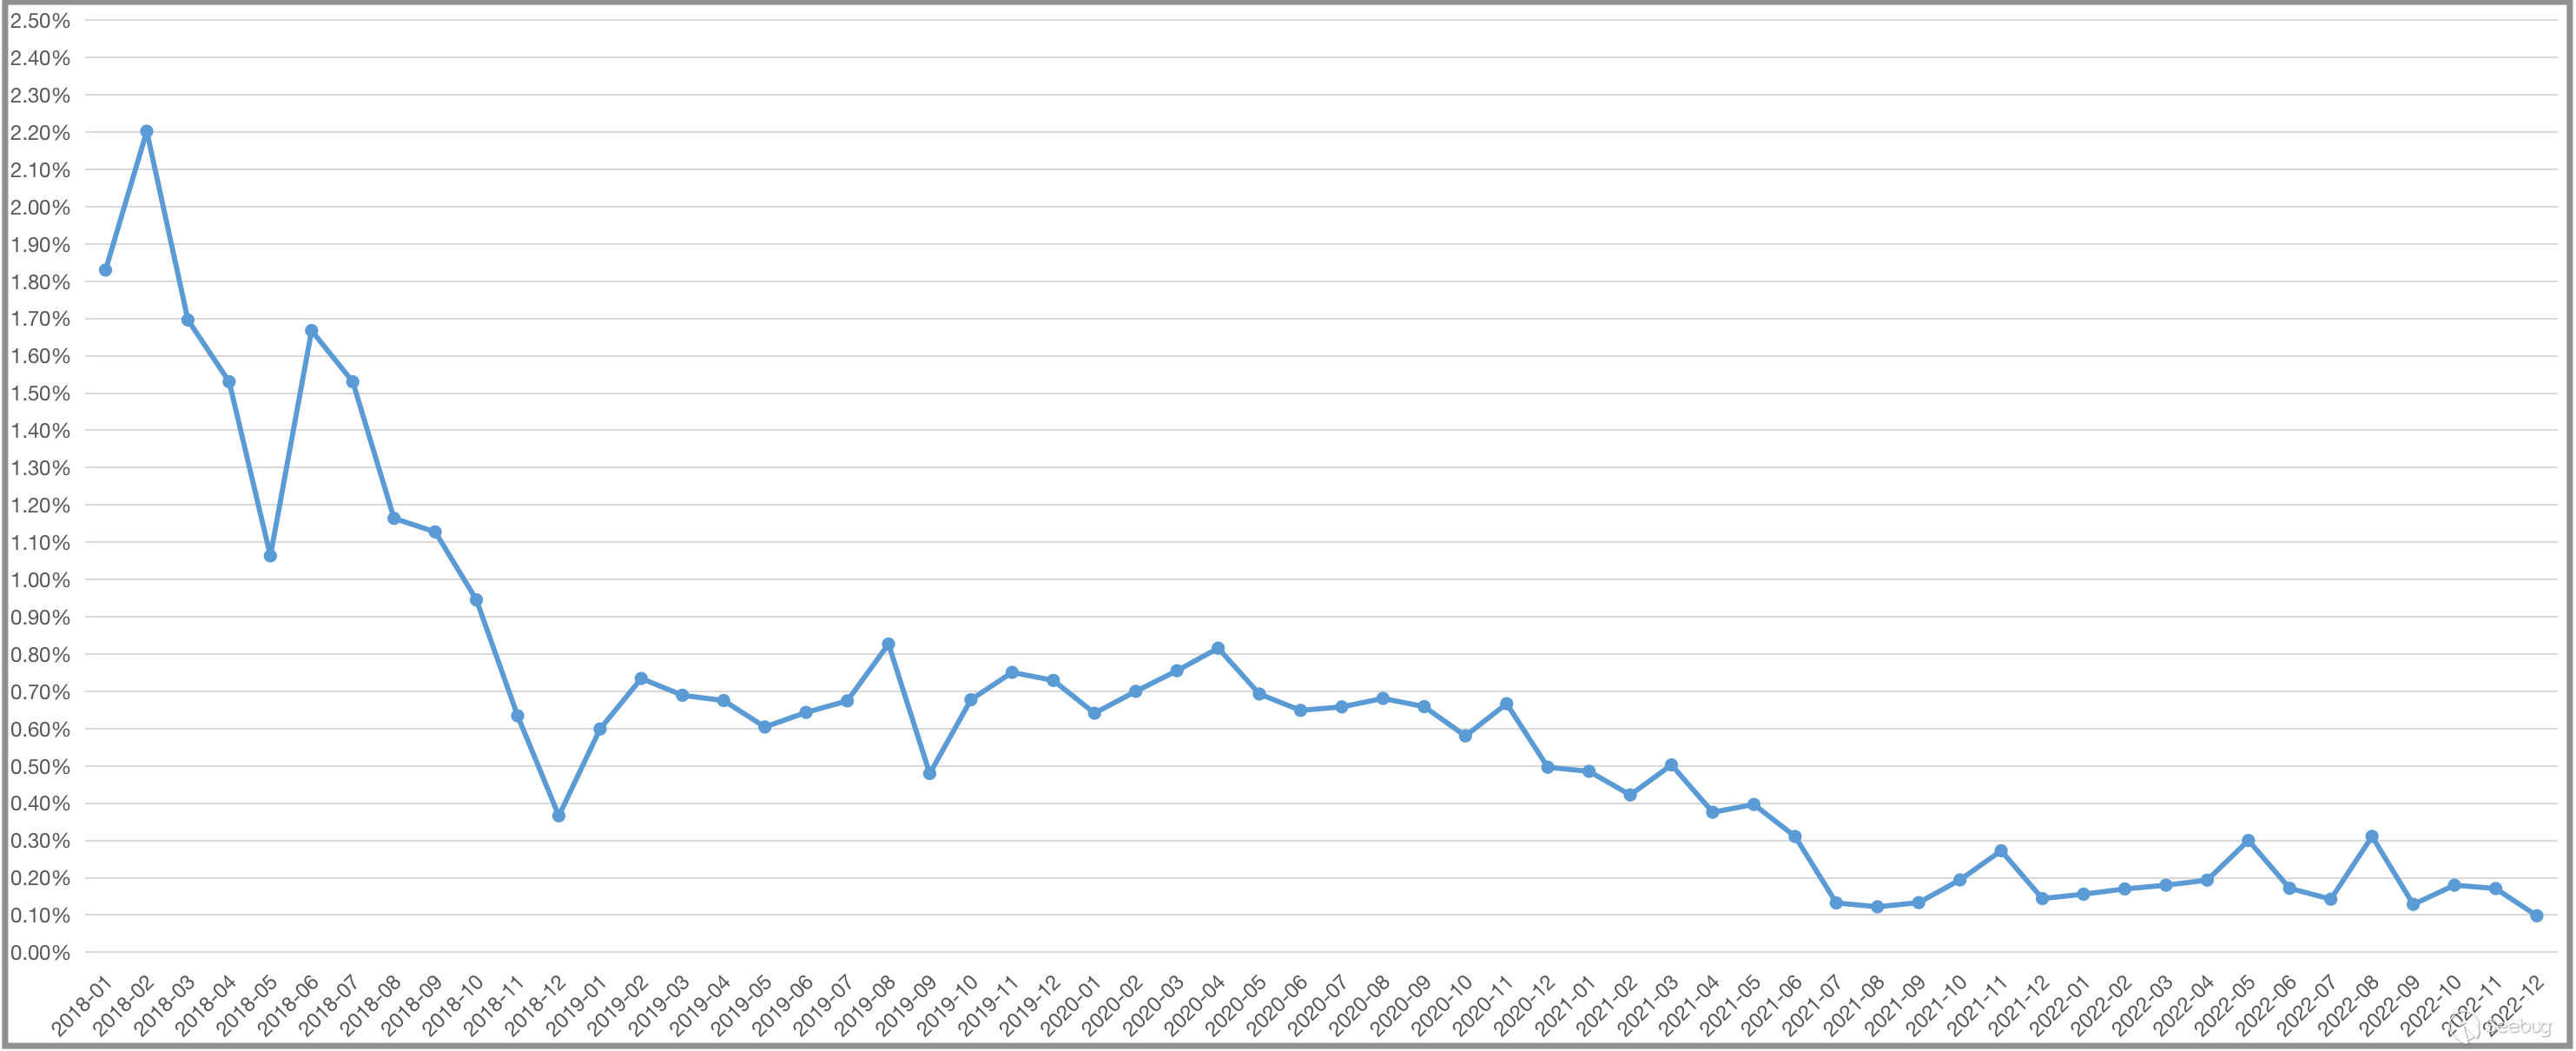
4.4 India
As one of the countries with rapid internet market growth in recent years, India displays the following trend in the proportion of its online IP counts to the global total.
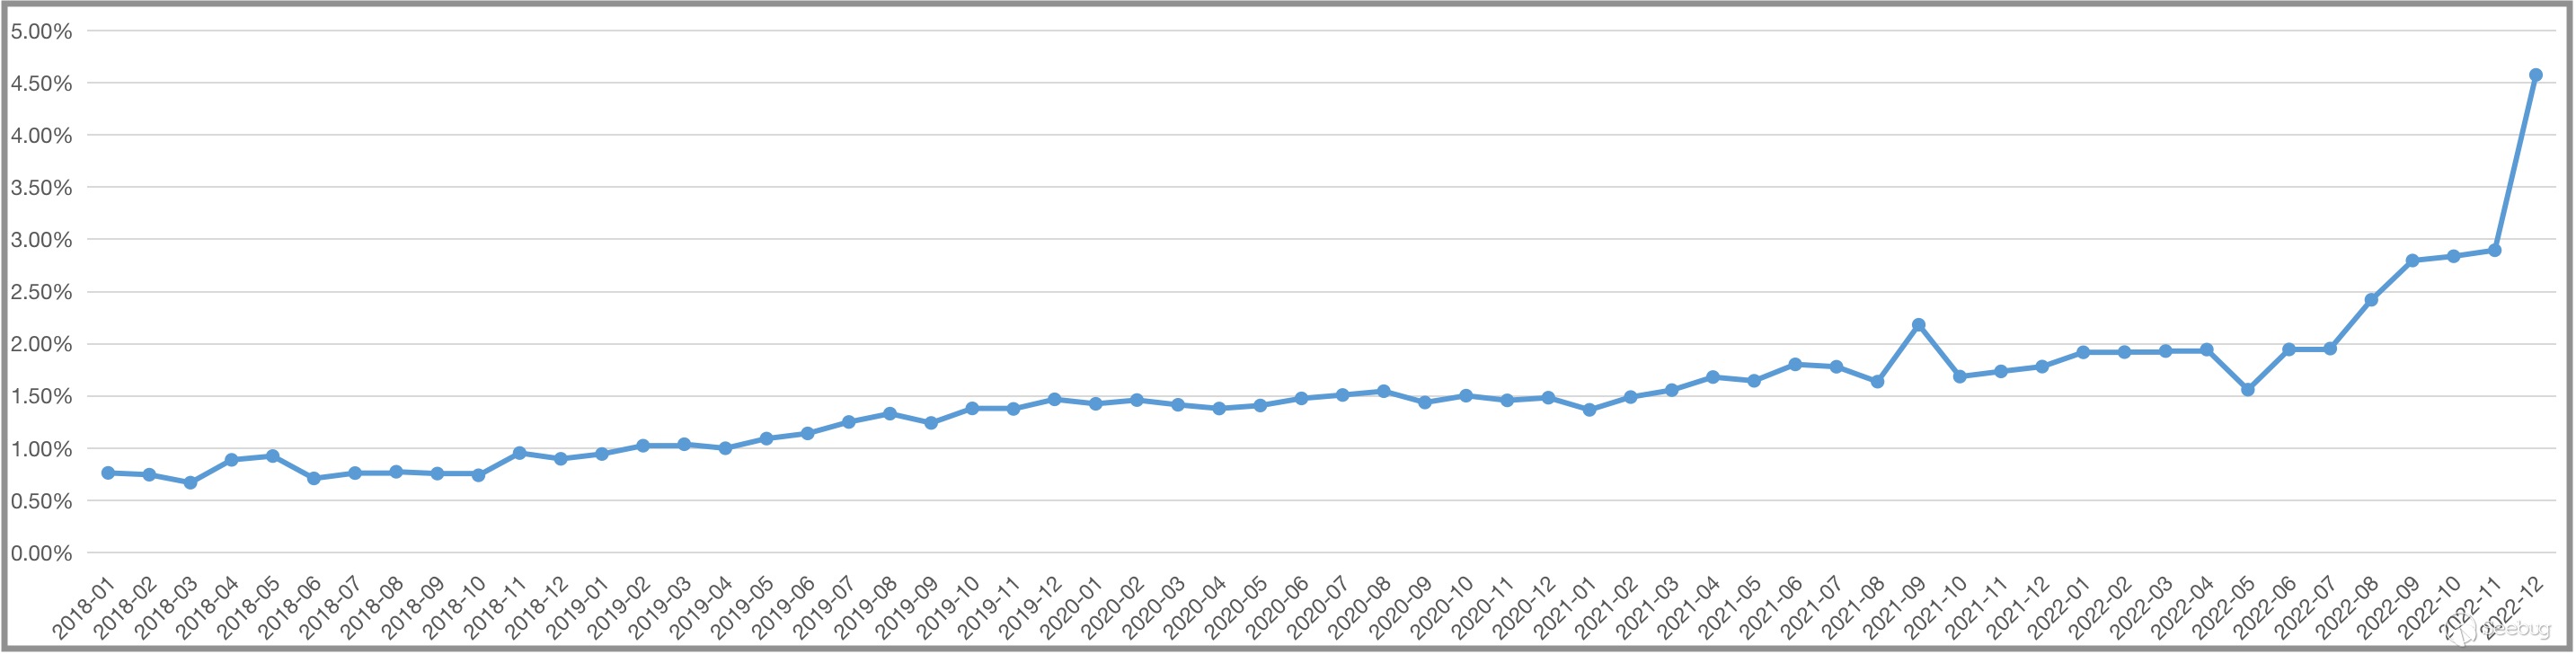
The proportion of online IP counts for India still lags behind that of the United States and China, reflecting India's relatively late start in internet development.
By observing the trend, we find that during 2018, the proportion of online IP counts for India remained below 1%. From 2019 to the first half of 2022, it ranged from 1% to 2%. In the second half of 2022, it consistently exceeded 2%. This continuous upward trend significantly reflects the sustained growth of internet development in India.
4.5 Indonesia
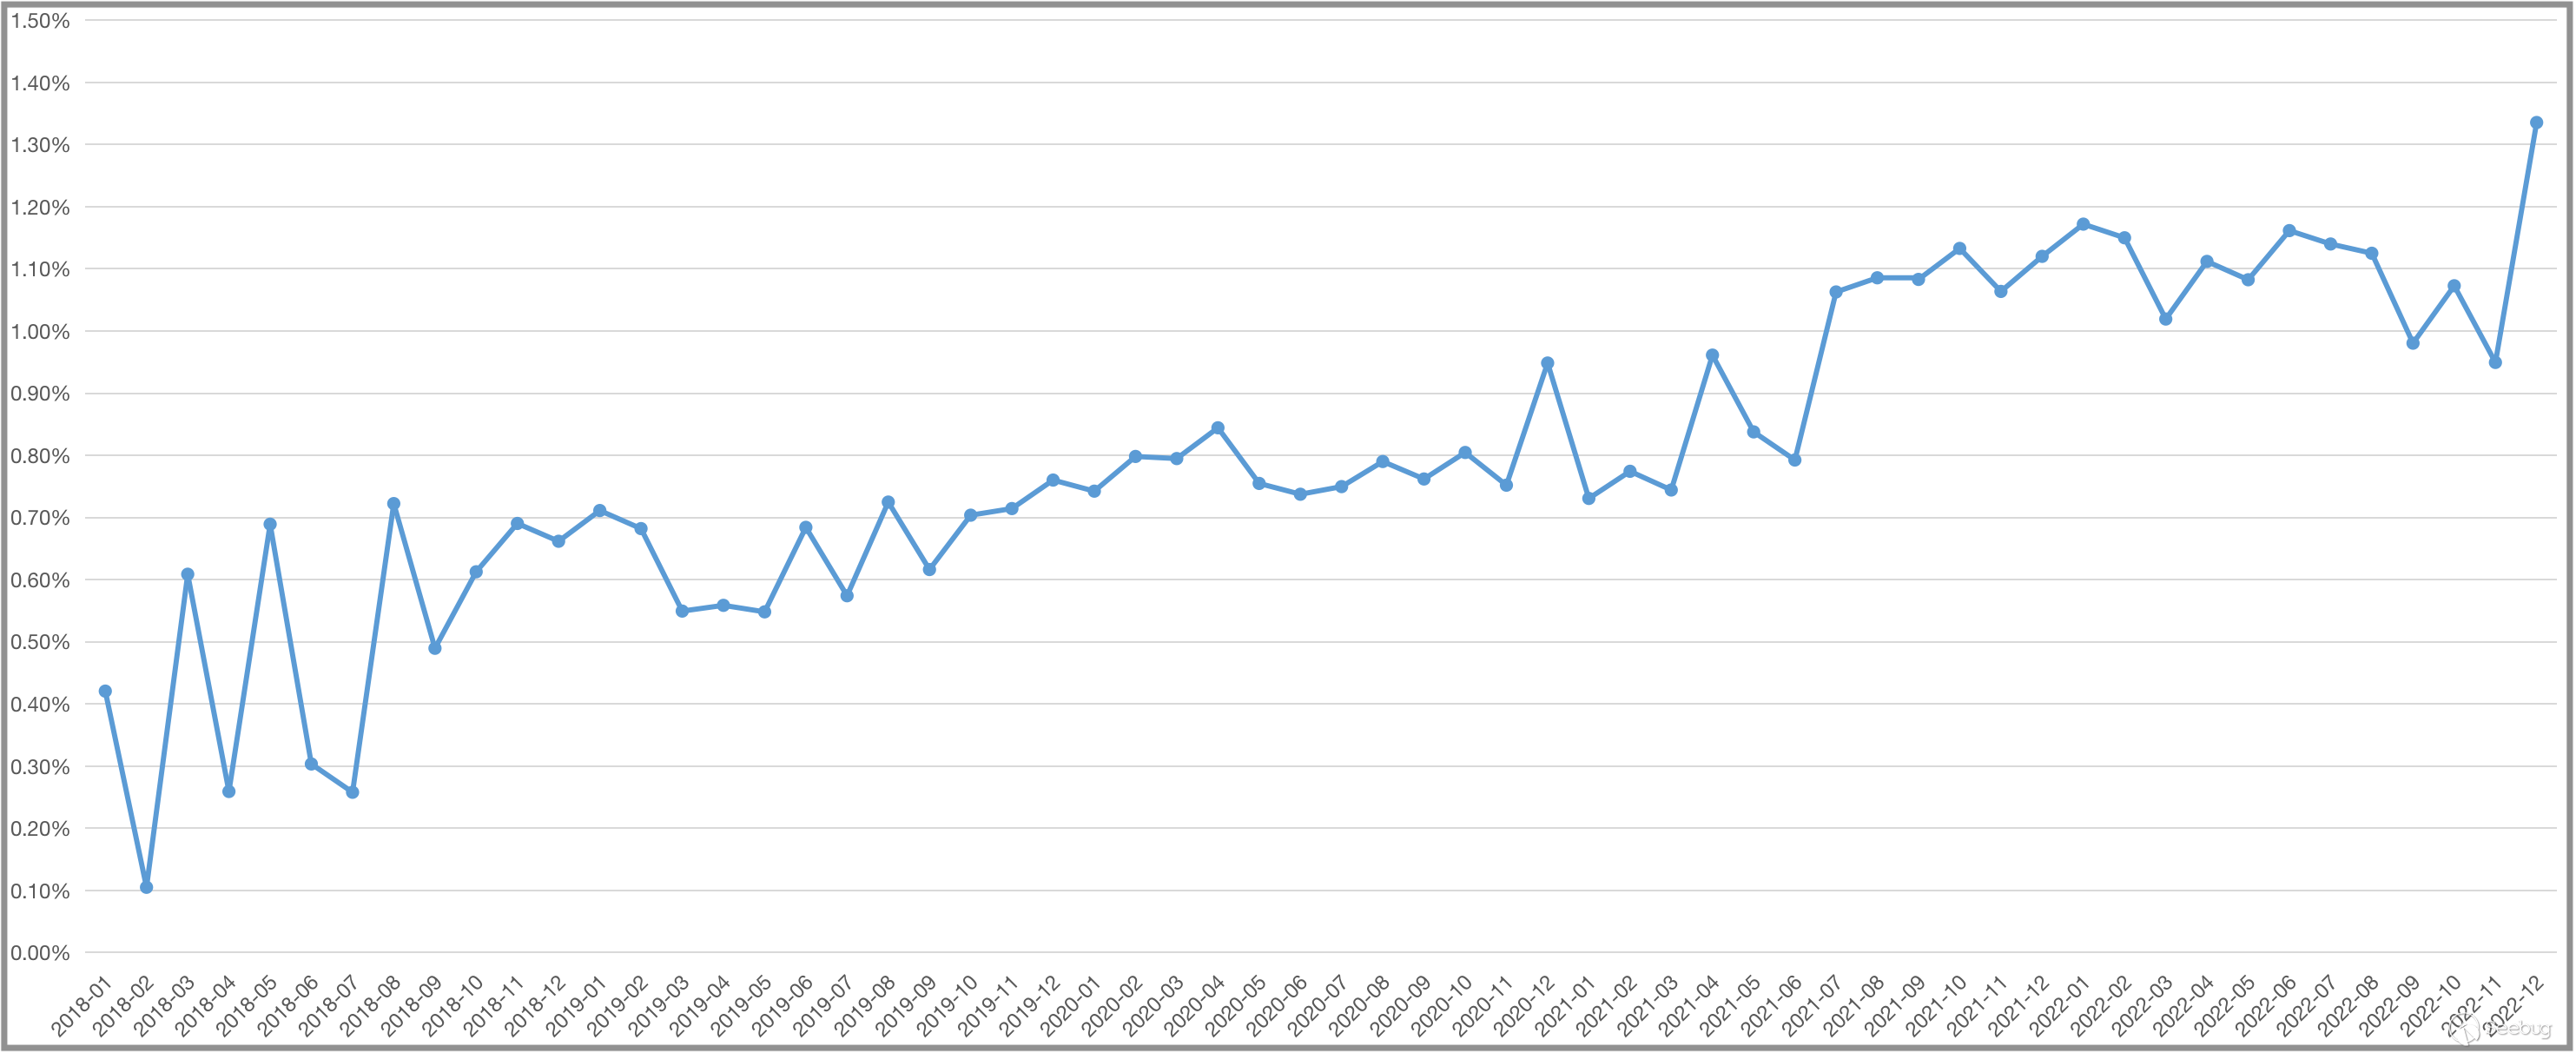
As the Southeast Asia's top-ranked country in terms of GDP, Indonesia exhibits the following trend in the proportion of its online IP counts to the global total.
In recent years, Indonesia has experienced rapid development in internet and cloud computing, with internet traffic growing by 20% throughout 2020 [14]. This is consistent with the continuous increase in the proportion of online IP counts for the country over the past five years.
In 2021, Indonesia released the "Indonesia Digital Roadmap 2021-2024," aiming to accelerate digital transformation in sectors such as economy, education, finance, transportation, and healthcare to achieve inclusive development of the digital economy [15]. It is believed that in the coming years, the proportion of online IP counts for Indonesia to the global total will continue to rise.
4.6 Ireland
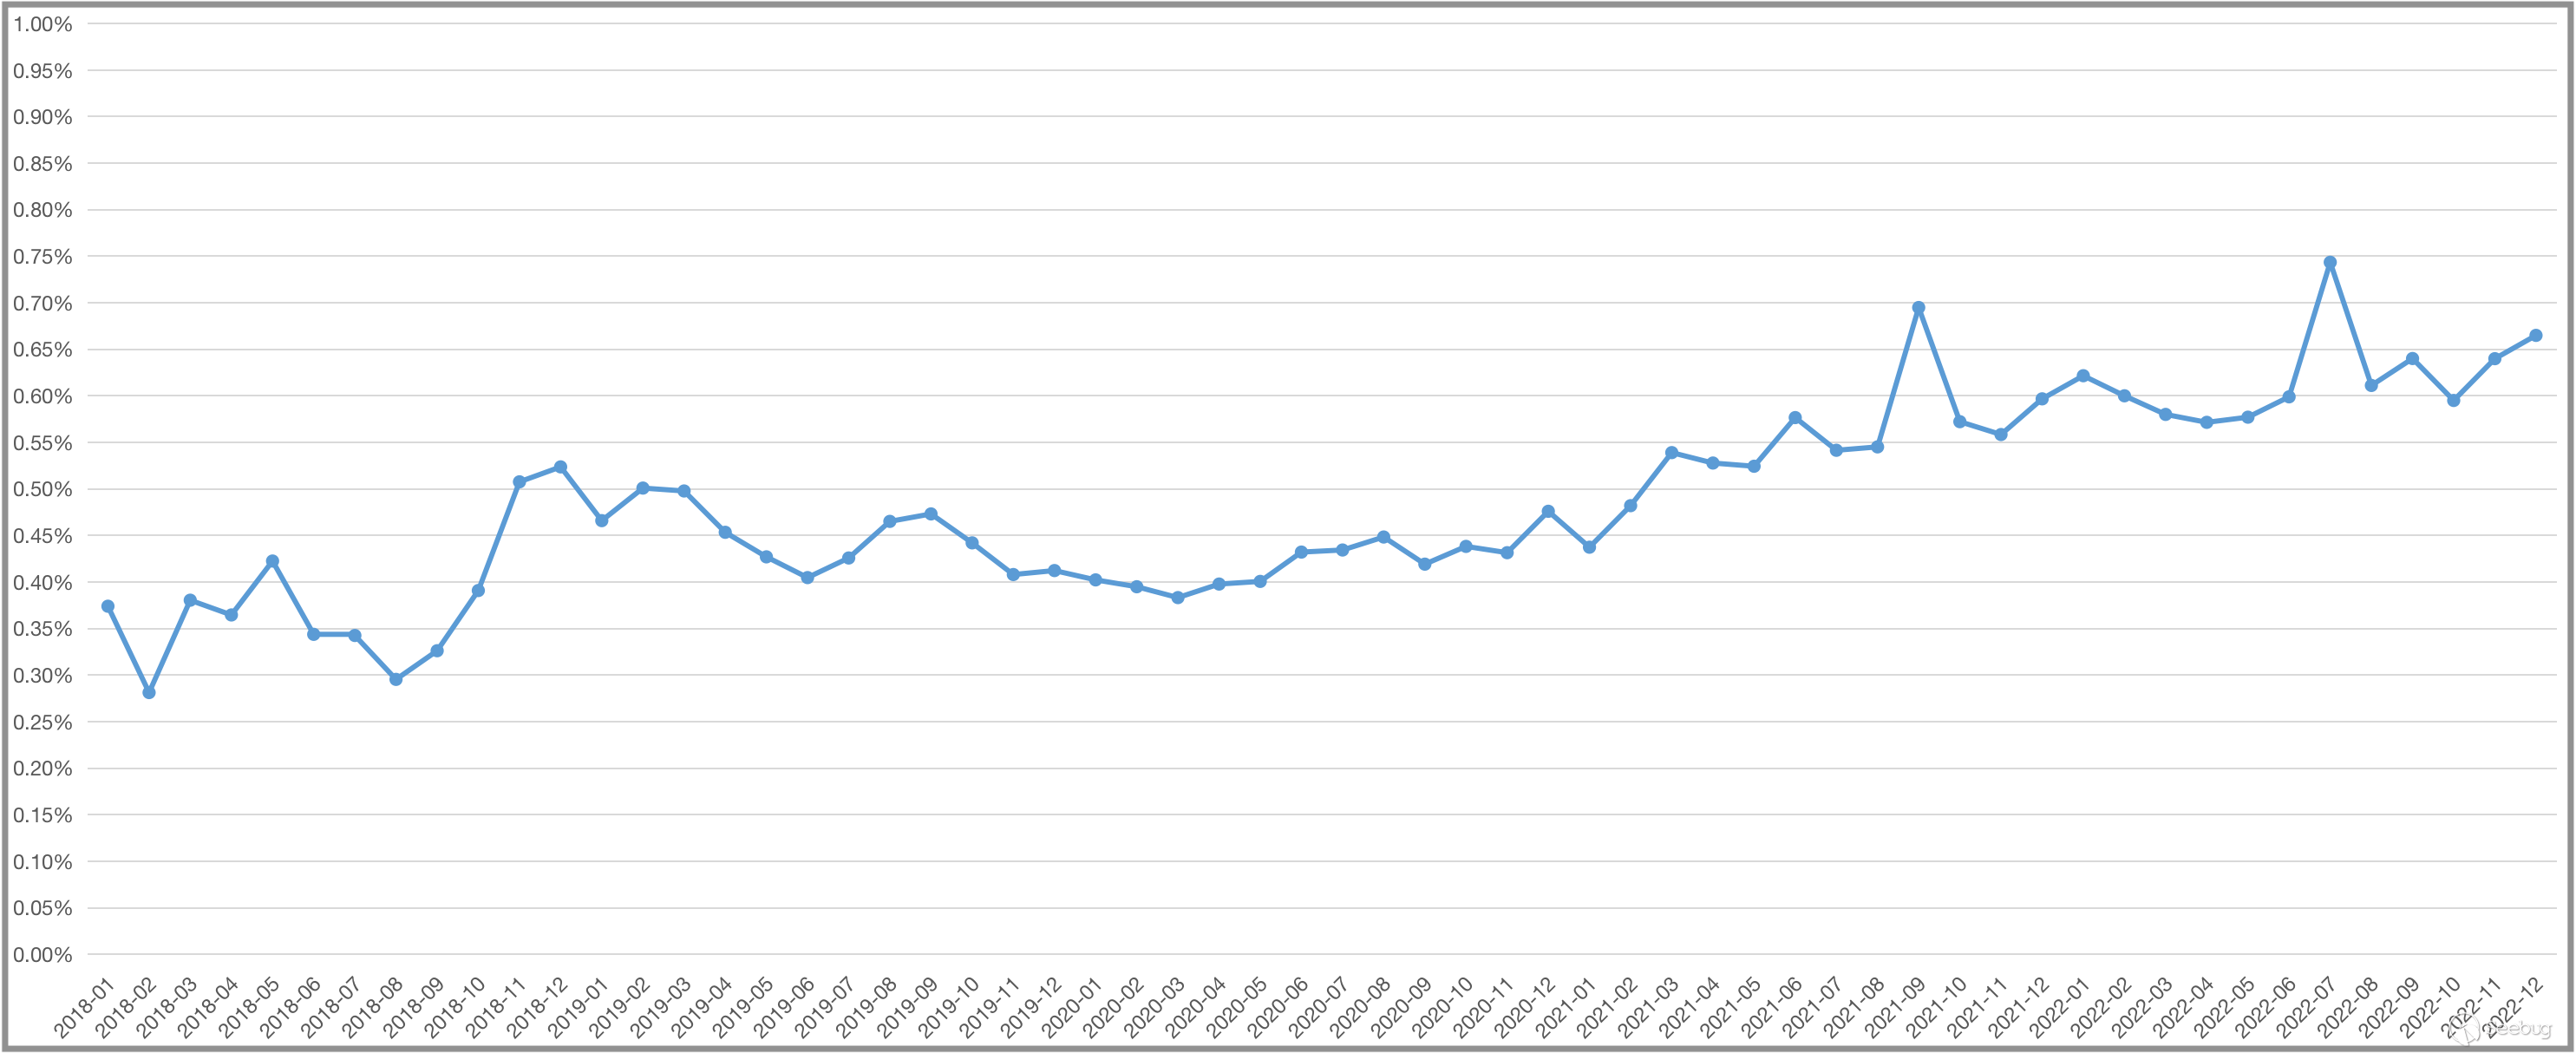
As one of the countries with rapid economic growth in recent years, Ireland displays the following trend in the proportion of its online IP counts to the global total.
By observing the trend, we find that the proportion of online IP counts for Ireland shows a continuous upward trend.
In 2021, Ireland's GDP was 268 billion, accounting for 53% of its GDP. Compared to other countries, Ireland has a high proportion of digital economy in terms of GDP. Due to its low corporate tax rate, many multinational companies establish their headquarters or European headquarters here for tax optimization purposes. For example, tech giants like Apple and Microsoft have set their EU headquarters in Ireland. Its software industry has become one of the iconic industries in the entire European region [16]. These factors contribute to the continuous growth of online IP counts in Ireland in recent years.
4.7 Saudi Arabia
As the only Arab country in the G20 group, Saudi Arabia exhibits the following trend in the proportion of its online IP counts to the global total.
By observing the trend, we find that the proportion of online IP counts for Saudi Arabia shows a continuous decline. This trend does not indicate a decline in the country's internet development level. However, it suggests that, comparatively, the gap between Saudi Arabia's internet development level and other developed countries is widening.
The country's economy is primarily reliant on energy, with a weak dependence on the digital economy. It is speculated that this is one of the reasons for the continuous decline in the proportion of online IP counts for Saudi Arabia to the global total.
This article is based on historical mapping data from the ZoomEye platform in recent years, with a monthly time period and a data timeframe spanning from 2018 to 2022. By analyzing and interpreting specific time-specific data in relatively low-frequency mapping data, we aim to practice the concept of "dynamic mapping."
Based on the concept of "dynamic mapping," both low-frequency mapping data and high-frequency mapping data can be analyzed and interpreted to extract more knowledge from different dimensions. Low-frequency mapping data is suitable for long-duration events and long-span analysis needs, while high-frequency mapping data is suitable for analysis needs after the occurrence of hot events.
In recent years, it is believed that there will be an increasing demand for high-frequency mapping (with a mapping cycle of days or even shorter) and mapping data analysis targeting specific regions after the occurrence of hot events in various industries.
[1] Exploring Cyberspace Mapping for Battlefields in Physical Warfare:https://mp.weixin.qq.com/s/vCfv78lXNj-z9kkn0wlmCg
[2] During the Kosovo Conflict, Insights from US Bell Labs:https://web.archive.org/web/20060206171634/http://research.lumeta.com/ches/map/yu/index.html
[3] Global Insights: Evaluating Cyber Warfare Defensive Capabilities of Nations:https://mp.weixin.qq.com/s/I1-1S_Dg1odFwEFkHjDSyQ
[4] ZoomEye Cyber Space Mapping: Impact of Venezuela Power Outage on Critical Network Infrastructure and Vital Information Systems:https://mp.weixin.qq.com/s/rGMggOde1XQjrYClphsi4A
[5] Cyber Space Perspective on the Turmoil in Kazakhstan:https://mp.weixin.qq.com/s/0lelsXVH3UAYPeqERlRGrg
[6] Unraveling the Fog of the Russia-Ukraine Conflict through ZoomEye Cyber Space Mapping:https://mp.weixin.qq.com/s__biz=MjM5NzA3Nzg2MA==&mid=2649858895&idx=1&sn=5401ac244cab115842632cc3102ddc49&scene=21
[7] Tracking the Longest Internet Shutdowns:https://internetshutdowns.in/
[8] 2019 Kashmir Demonstrations:https://zh.wikipedia.org/zh-hans/2019 年喀什米爾示威
[9] Suppression of Information in Kashmir:https://en.wikipedia.org/wiki/Censorship_in_Kashmir
[10] Resumption of Internet Access in Indian-Administered Kashmir After Six-Month Blockade, Still Limited to 300 Whitelisted Websites:http://news.china.com.cn/2020-01/26/content_75649287.htm
[11] Chad Lifted the 16-Month Social Media Shutdown, but Concerns Persist:https://cipesa.org/2019/10/chad-lifted-the-16-months-social-media-shutdown-but-concerns-remain/
[12] Nationwide Internet Disruption in Australia:http://www.xinhuanet.com/world/2019-07/13/c_1210192821.htm
[13] Broadband Network Disruptions in Multiple Locations including London, UK:http://m.news.cctv.com/2020/06/26/ARTIFFq3lytLv0YxnSQTrLrk200626.shtml
[14] Global Whitepaper on Digital Economy (2022) - China Academy of Information and Communications Technology (CAICT):http://www.caict.ac.cn/kxyj/qwfb/bps/202212/P020221207397428021671.pdf
[15] Overview of Indonesia's Economic and Trade Development and Market Prospects Guide:https://www.ccpit.org/a/20230504/20230504uw78.html
[16]Endow data with soul —— Exploring the relationship between cyberspace mapping data and GDP:https://mp.weixin.qq.com/s/hiDjbSPFeWiDfjOlJG8Deg
 本文由 Seebug Paper 发布,如需转载请注明来源。本文地址:https://paper.seebug.org/3025/
如有侵权请联系:admin#unsafe.sh