Loading...
6 min read
Today, we are excited to announce Cloudflare Trace! Cloudflare Trace is available to all our customers. Cloudflare Trace enables you to understand how HTTP requests traverse your zone's configuration and what Cloudflare Rules are being applied to the request.
For many Cloudflare customers, the journey their customers' traffic embarks on through the Cloudflare ecosystem was a mysterious black box. It's a complex voyage, routed through various products, each capable of introducing modification to the request.
Consider this scenario: your web traffic could get blocked by WAF Custom Rules or Managed Rules (WAF); it might face rate limiting, or undergo modifications via Transform Rules, Where a Cloudflare account has many admins, modifying different things it can be akin to a game of "hit and hope," where the outcome of your web traffic's journey is uncertain as you are unsure how another admins rule will impact the request before or after yours. While Cloudflare's individual products are designed to be intuitive, their interoperation, or how they work together, hasn't always been as transparent as our customers need it to be. Cloudflare Trace changes this.
Running a trace
Cloudflare Trace allows users to set a number of request variables, allowing you to tailor your trace precisely to your needs. A basic trace will require users to define two settings. A URL that is being proxied through Cloudflare and an HTTP method such as GET. However, customers can also set request headers, add a request body and even set a bot score to allow users to validate the correct behavior of their security rules.
Once a trace is initiated, the dashboard returns a visualization of the products that were matched on a request, such as Configuration Rules, Transform Rules, and Firewall Rules, along with the specific rules inside these phases that were applied. Customers can then view further details of the filters and actions the specific rule undertakes. Clicking the rule id will take you directly to that specific rule in the Cloudflare Dashboard, allowing you to edit filters and actions if needed.
The user interface also generates a programmatic version of the trace that can be used by customers to run traces via a command line. This enables customers to use tools like jq to further investigate the extensive details returned via the trace output.
The life of a Cloudflare request
Understanding the intricate journey that your traffic embarks on within Cloudflare can be a challenging task for many of our customers and even for Cloudflare employees. This complexity often leads to questions within our Cloudflare Community or direct inquiries to our support team. Internally, over the past 13 years at Cloudflare, numerous individuals have attempted to explain this journey through diagrams. We maintain an internal Wiki page titled 'Life of a Request Museum.' This page archives all the attempts made over the years by some of the first Cloudflare engineers, heads of product, and our marketing team, where the following image was used in our 2018 marketing slides.
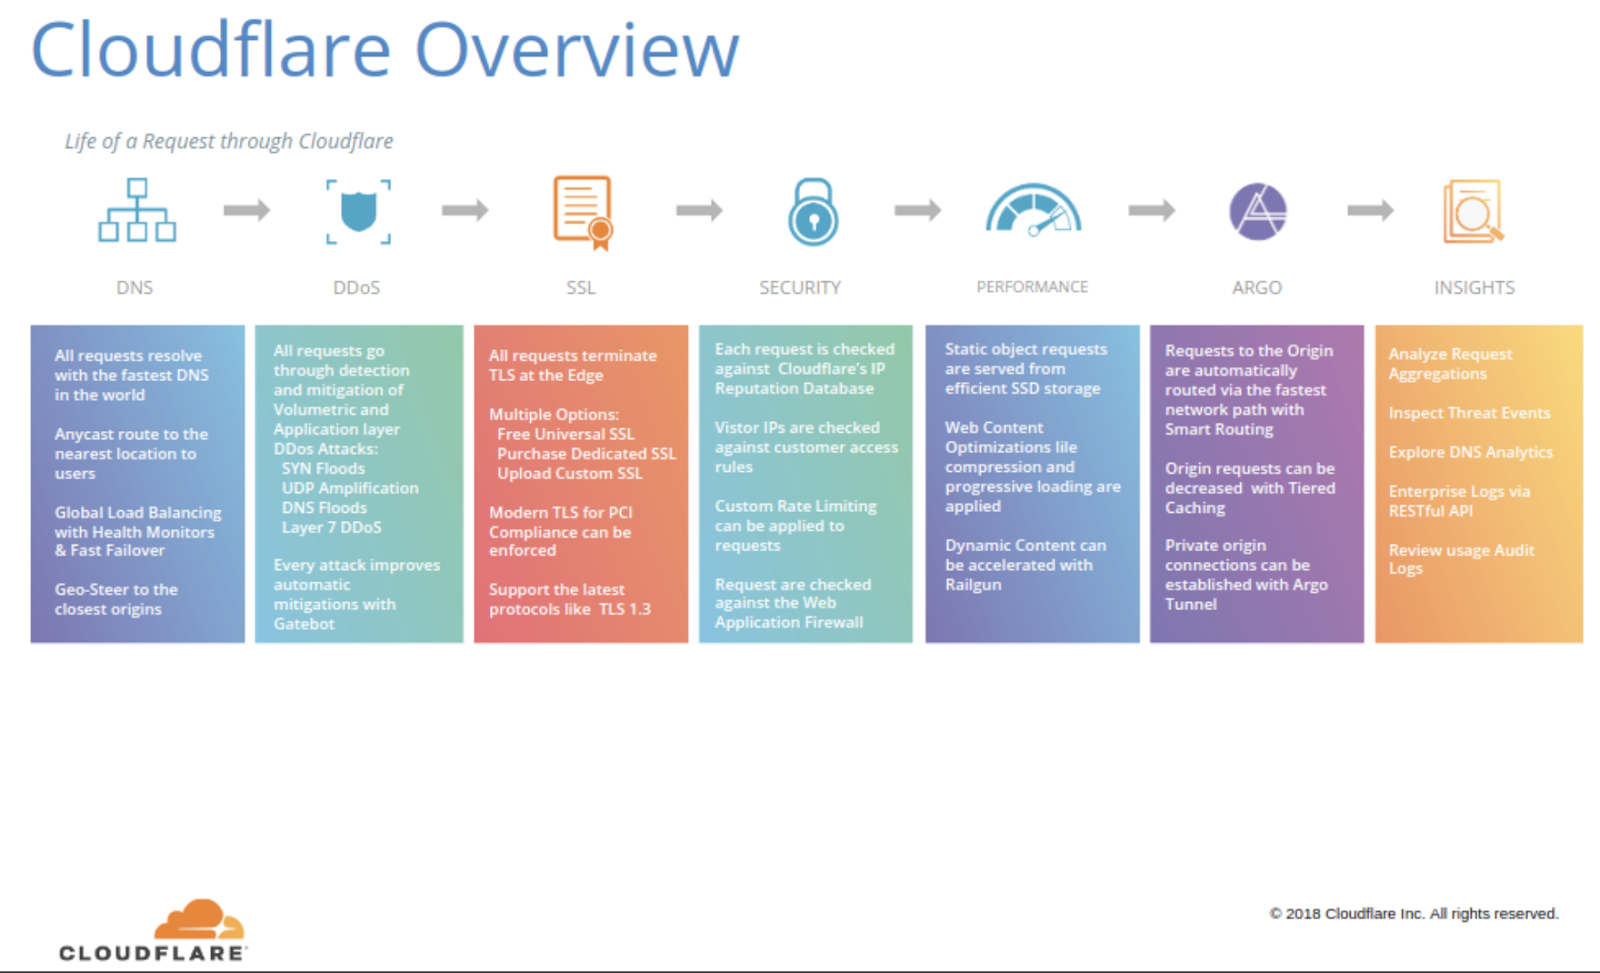
The "problem" (a rather positive one) is that Cloudflare is innovating so rapidly. New products are being added, code is removed, and existing products are continually enhanced. As a result, a diagram created just a few weeks ago can quickly become outdated and challenging to keep up to date.
Finding a happy medium
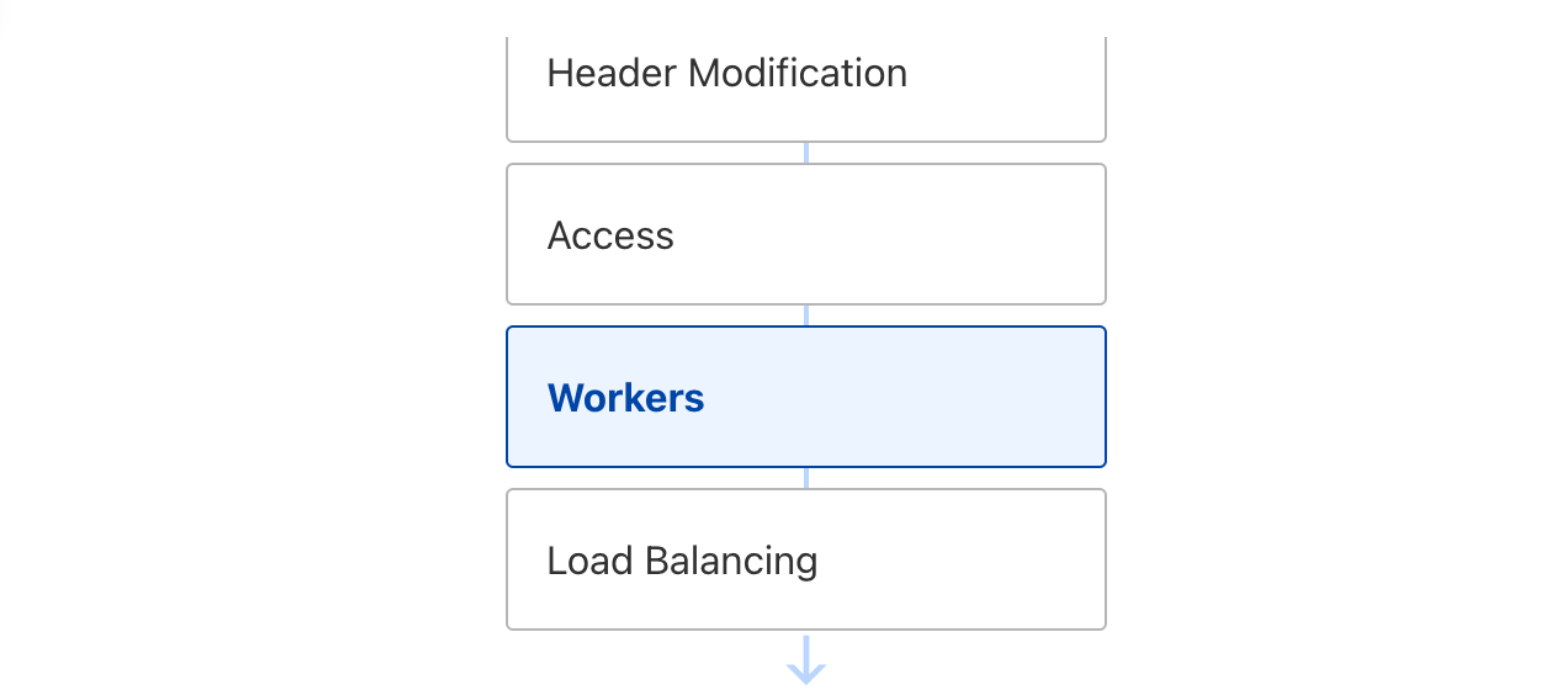
However, customers still want to understand, “The life of a request.” Striking the ideal balance between providing just enough detail without overwhelming our users posed a problem akin to the Goldilocks principle. One of our first attempts to detail the ordering of Cloudflare products was Traffic Sequence, a straightforward dashboard illustration that provides a basic, high-level overview of the interactions between Cloudflare products. While it does not detail every intricacy, it helps our customers understand the order and flow of products that interacted with an HTTP request and was a welcome addition to the Cloudflare dashboard.
However, customers still requested further insights and details. Especially around debugging issues. Internally Cloudflare teams utilize a number of self created products to trace a request. One of these products is Flute. This product gives a verbose output of all rules, Cloudflare features and codepaths a request undertakes. This allows our engineers and support teams to investigate an issue and identify if something is awry. For example in the following Flute trace image you can see how a request for my domain is evaluated against Single Redirects, Waiting Room, Configuration Settings, Snippets and Origin Rules.
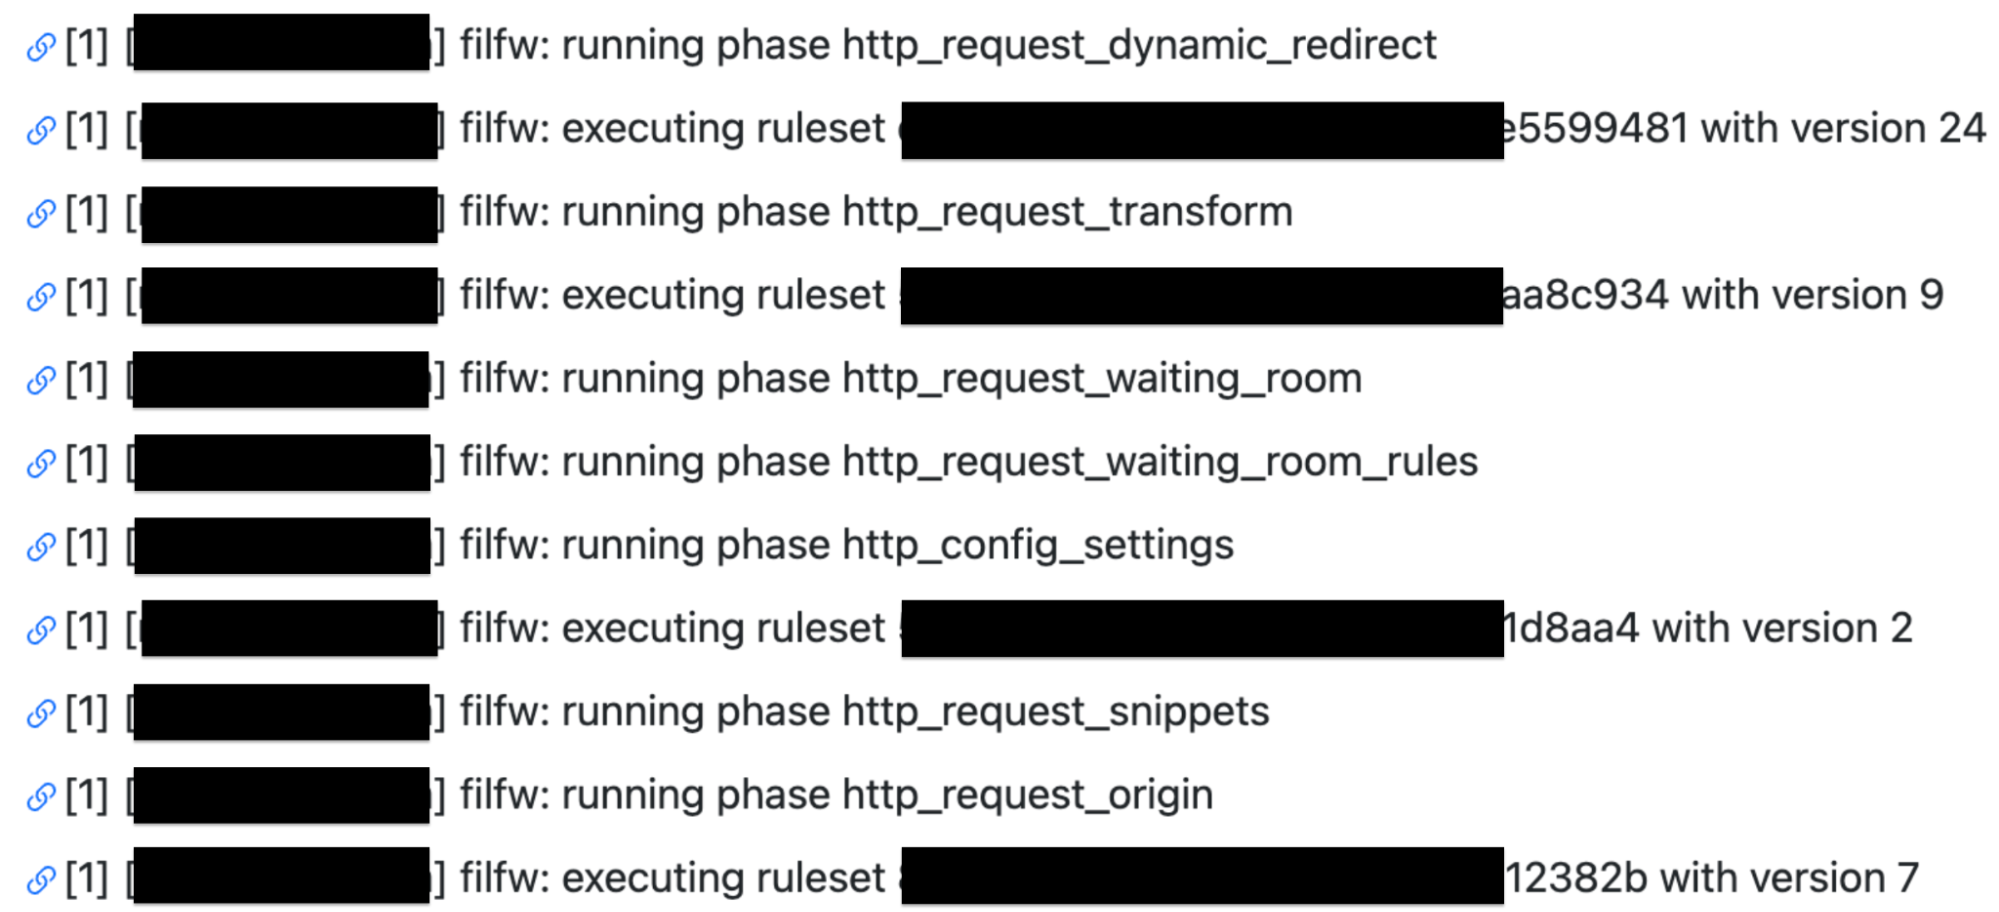
The Flute tool became one of the key focal points in the development of Cloudflare Trace. However, it can be quite intricate and packed with extensive details, potentially leading to more questions than solutions if copied verbatim and exposed to our customers.
To understand the happy medium in developing Cloudflare Trace. We closely collaborated with our Support team to gain a deeper understanding of the challenges our customers faced specifically around Cloudflare Rulesets. The primary challenge centered around understanding which rules were applicable to specific requests. Customers often raised queries, and in certain instances, these inquiries had to be escalated for further investigation into the reasons behind a request's specific behavior. By empowering our customers to independently investigate and comprehend these issues, we identified a second area where Cloudflare Trace proves invaluable—by reducing the workload of our support team and enabling them to operate more efficiently while focusing on other support tickets.
For customers encountering genuine problems, they have the capability to export the JSON response of a trace, which can then be directly uploaded to a support ticket. This streamlined process significantly reduces the time required to investigate and resolve support tickets.
Trace examples
Cloudflare Trace has been available via API for the last nine months. We have been working with a number of customers and stakeholders to understand where tracing is beneficial and solving customer problems. Here are some of the real world examples that we have solved using Cloudflare Trace.
Transform Rules inconsistently matching
A customer encountered an issue while attempting to rewrite a URL to their origin for specific paths using Transform rules. The Cloudflare account created a filter that employed regex to match against a specific path.
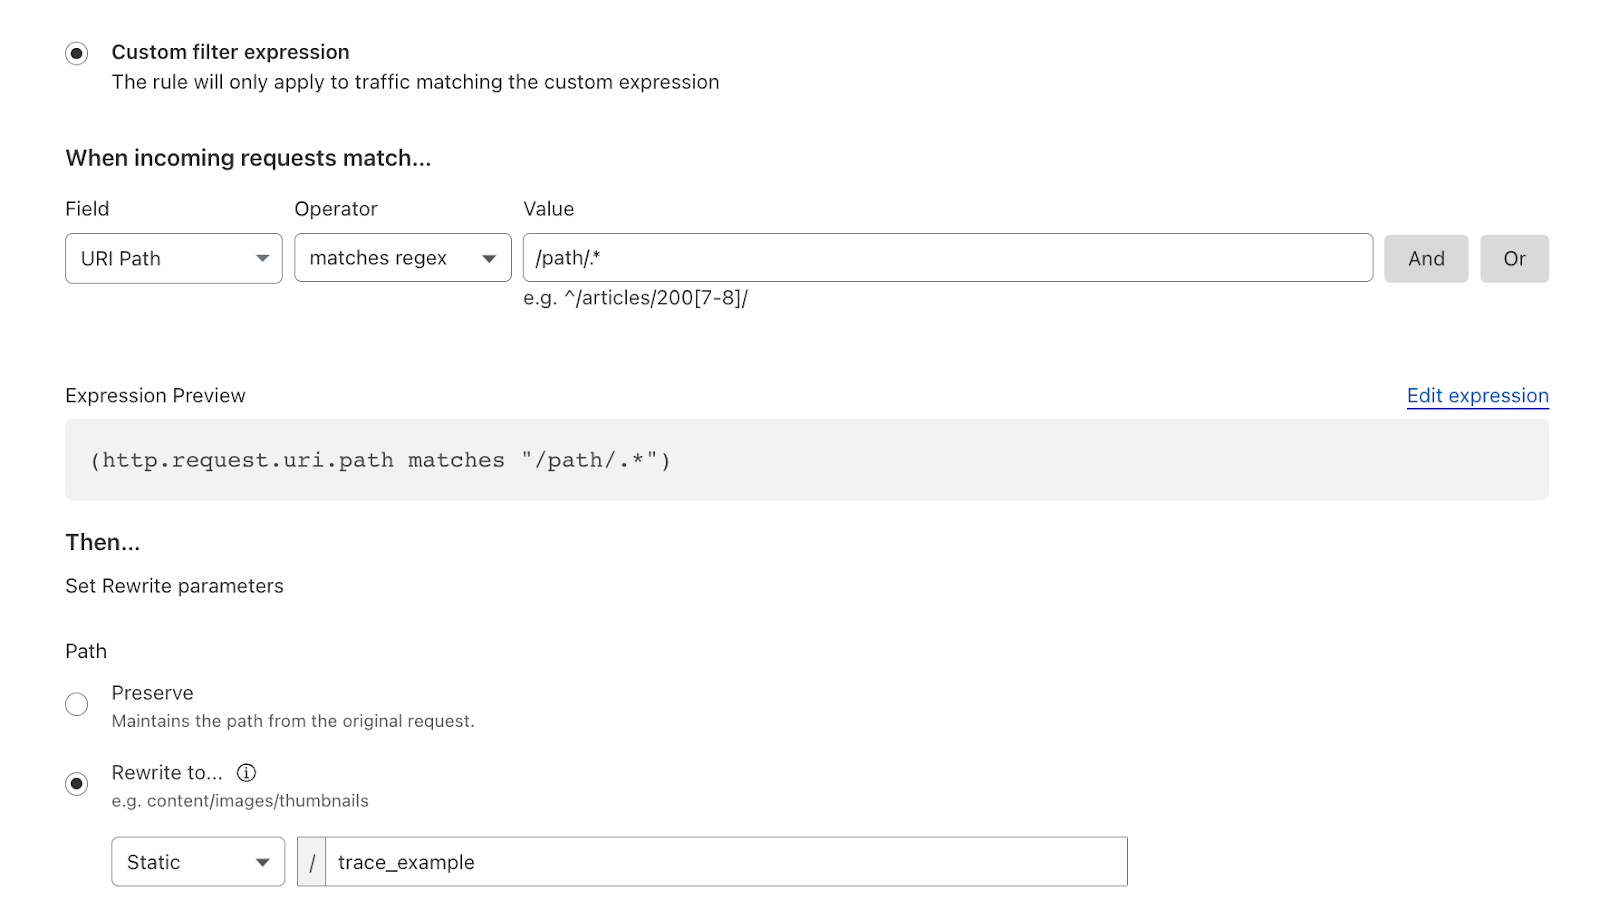
A systems administrator monitoring their web server observed in their logs that the URLs for a small percentage of requests were not transforming correctly, causing disruptions to the application. They decided to investigate by comparing a correctly functioning request with one that was not, and subsequently conducted traces.
In the problematic trace, only one rule matched the trace parameters and was setting incorrect parameters.
Whereas on the other URL the rule that contained the regex matched as intended and set the correct URL parameters.
This allowed the sysadmin to pinpoint the problem: the regex was specifically designed to handle requests with subdirectories, but it failed to address cases where requests directly targeted the root or a non-subdirectory path. After identifying this issue within the traces, the sysadmin updated the filter. Subsequently, both cases matched successfully, leading to the resolution of the problem.
What origin?
When a request encounters a Cloudflare ruleset, such as Origin Rules, all the rules are evaluated, and any rule that is matched is applied in sequential order of priority. This means that multiple settings could be applied from different rules. For example, a Host Header could be set in rule 1, and a DNS origin could be assigned in rule 3. This means that the request will exit the Origin Rules phase with a new Host Header and be routed to a different origin. Cloudflare Trace allows users to easily see all the rules that matched and altered the request.
Tracing the future
Cloudflare Trace will be available to all our customers over this coming week. And located within the Account section of your Cloudflare Dashboard for all plans. We are excited to introduce additional features and products to Cloudflare Trace in the coming months. In the future will also be developing scheduling and alerts, which will enable you to monitor if a newly deployed rule is impacting the critical path of your application. As with all our products, we value your feedback. Within the Trace dashboard, you'll find a form for providing feedback and feature requests to help us enhance the product before its general release.
We protect entire corporate networks, help customers build Internet-scale applications efficiently, accelerate any website or Internet application, ward off DDoS attacks, keep hackers at bay, and can help you on your journey to Zero Trust.
Visit 1.1.1.1 from any device to get started with our free app that makes your Internet faster and safer.
To learn more about our mission to help build a better Internet, start here. If you're looking for a new career direction, check out our open positions.

