At DataDome, we ensure our customers are protected—without extra friction like slow loading speeds. We are obsessed with performance, processing and analyzing every single HTTP request on our customers’ websites in real time in less than 2 milliseconds! And with over 3 trillion signals analyzed every day, optimization of our solution is key.
To aid our detection capabilities, we use a JavaScript tag to collect client-side signals:
- Browser fingerprints used in the context of bot detection.
- Information about the end-user device, browser, and OS such as the device memory, number of CPU cores, and GPU information.
- Client-side behavior such as mouse movements and touch events.
- Specially crafted JavaScript (JS) challenges that aim to detect side effects of automated browsers, headless browsers, and anti-detection frameworks.
While the JS tag already had a negligible impact on our customers’ websites, we are always pushing for better solutions. With a focus on improving performance, we worked hard the last few months to further optimize the JS tag.
Client-Side Tag Optimizations: Key Results
From June 2023 to November 2023, we reduced:
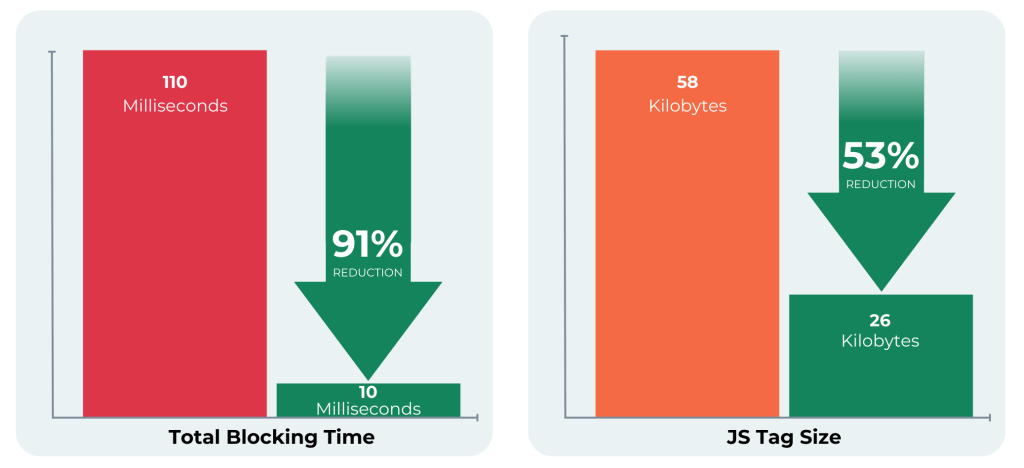
- Total Blocking Time from 110 ms to 10 ms (a reduction of 91%).
- Measurements were performed by third party providers: speedcurve.com & pagespeed.web.dev on slow mobile devices (Moto G Power – 4x slowdown Simulated).
- JS tag size (gzipped) from 58 kB to 26 kB (a reduction of 53%).
- Measurements were performed by third party providers: speedcurve.com & WebPageTest.org.

What are the benefits of optimization?
How your site performs is key for your customers, who on average will only give a website three seconds to load before clicking away. Website load time (either server-side or client-side load time) has an impact on conversion rate and bounce rate, as demonstrated in several analyses and audits.
- Rakuten 24 increased revenue per visitor by ~54% and conversion rate by ~33% by investing in Core Web Vitals, like website load time.
- Vodafone noticed a sales increase of 8% following a 31% improvement in LCP (Largest Contentful Paint), one of the three main pillars of Core Web Vitals.
While there are many ways to monitor the web performance of a site, Core Web Vitals are one of the most followed metrics in the market for testing the speed of a website, as well as a key part of SEO.
And at DataDome, we maintain a focus on reducing our ecological footprint. By reducing the size of our JS tag—which is loaded millions of times a day—we are reducing the bandwidth usage behind the scene and our footprint!
How did we improve our JS tag performance?
We went through four main processes to optimize our tag.
1. Refactored Our Code
While simple, this step is mandatory for any performance optimization project. Some parts of our JavaScript were duplicated across our code base. By refactoring it, we have been able to achieve better code and reduce the bundle size by 15%.
2. Optimized Our Code
By performing JavaScript code profiling, we have been able to find which parts of our code were using the most CPU resources. We refactored these parts—when possible—to reduce precious CPU usage.
3. Split & Obfuscated Our Logic
We don’t want bots to reverse engineer our JS tag, so by design we protect it with a custom (in-house) obfuscator.
In the past, we used to obfuscate everything inside our JS tag. But we don’t need to obfuscate everything. For instance, how we display a CAPTCHA is not confidential, as it is just vanilla JS and doesn’t aid in our detection capabilities. We have therefore split our JS file into two “modules”:
- CAPTCHA Display Logic. This logic hooks any HTTP calls and displays our CAPTCHA on XHR Requests. This code doesn’t need to be obfuscated.
- Collect Client-Side Signals. This code must be obfuscated to avoid reverse engineering.
4. Offloaded the Computation of Some Signals Outside the Browser Main Thread
Some of our signals are more intensive to compute.These signals used to be computed inside the browser JavaScript main thread. Using the main thread for this was adding a few milliseconds to the page render speed, particularly on slow devices.
“Total Blocking Time” measures the amount of time when the main thread is blocked, and is the main metric we focused on reducing. We moved these signals to a dedicated service worker, using another thread to compute them to avoid blocking the browser main thread.
Conclusion
The engineering team has worked for a long time to achieve this amazing performance improvement. We ran hundreds of tests to find the best performance possible—without compromising security.
We still have some improvements in our pipe to continue to have the fastest JS tag in the market and improve our detection. Stay tuned!
*** This is a Security Bloggers Network syndicated blog from DataDome authored by Alexandre Marlot. Read the original post at: https://datadome.co/engineering/client-side-javascript-tag-optimizations/
