01/08/2024
6 min read

One of the roles of Cloudflare's Observability Platform team is managing the operation, improvement, and maintenance of our internal logging pipelines. These pipelines are used to ship debugging logs from every service across Cloudflare’s infrastructure into a centralised location, allowing our engineers to operate and debug their services in near real time. In this post, we’re going to go over what that looks like, how we achieve high availability, and how we meet our Service Level Objectives (SLOs) while shipping close to a million log lines per second.
Logging itself is a simple concept. Virtually every programmer has written a Hello, World! program at some point. Printing something to the console like that is logging, whether intentional or not.
Logging pipelines have been around since the beginning of computing itself. Starting with putting string lines in a file, or simply in memory, our industry quickly outgrew the concept of each machine in the network having its own logs. To centralise logging, and to provide scaling beyond a single machine, we invented protocols such as the BSD Syslog Protocol to provide a method for individual machines to send logs over the network to a collector, providing a single pane of glass for logs over an entire set of machines.
Our logging infrastructure at Cloudflare is a bit more complicated, but still builds on these foundational principles.
The beginning
Logs at Cloudflare start the same as any other, with a println. Generally systems don’t call println directly however, they outsource that logic to a logging library. Systems at Cloudflare use various logging libraries such as Go’s zerolog, C++’s KJ_LOG, or Rusts log, however anything that is able to print lines to a program's stdout/stderr streams is compatible with our pipeline. This offers our engineers the greatest flexibility in choosing tools that work for them and their teams.
Because we use systemd for most of our service management, these stdout/stderr streams are generally piped into systemd-journald which handles the local machine logs. With its RateLimitBurst and RateLimitInterval configurations, this gives us a simple knob to control the output of any given service on a machine. This has given our logging pipeline the colloquial name of the “journal pipeline”, however as we will see, our pipeline has expanded far beyond just journald logs.
Syslog-NG
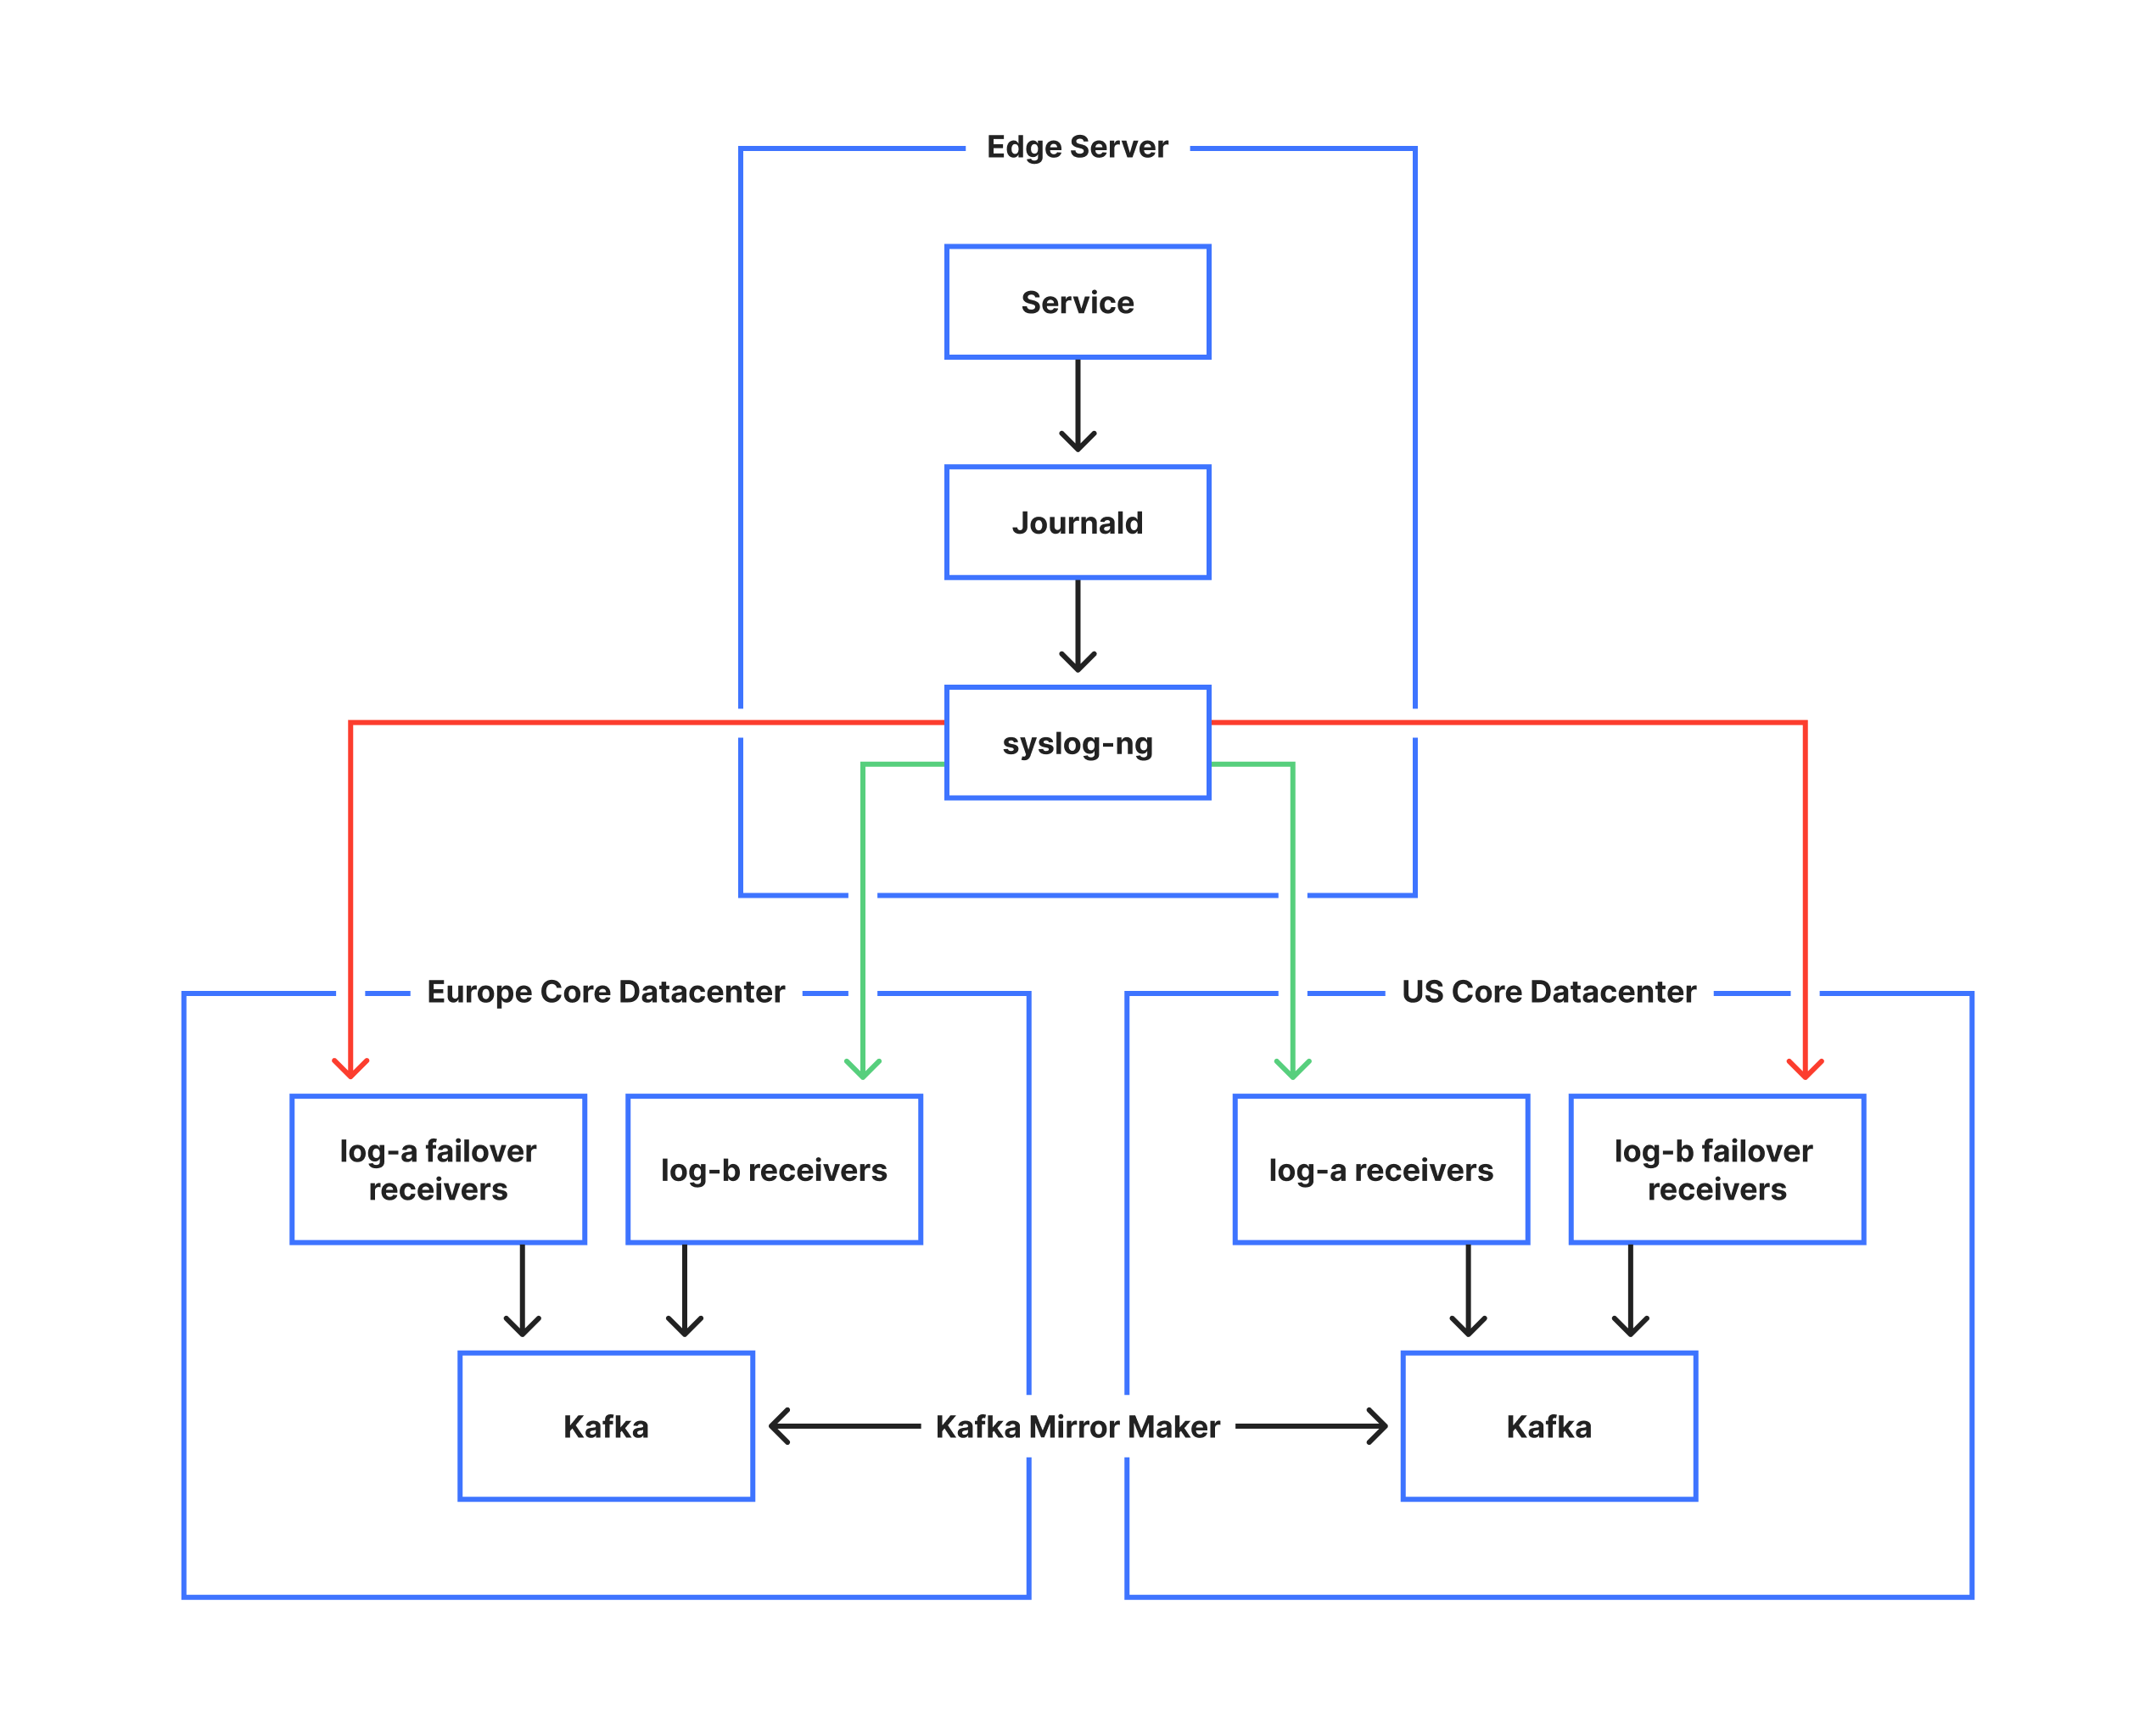
While journald provides us a method to collect logs on every machine, logging onto each machine individually is impractical for debugging large scale services. To this end, the next step of our pipeline is syslog-ng. Syslog-ng is a daemon that implements the aforementioned BSD syslog protocol. In our case, it reads logs from journald, and applies another layer of rate limiting. It then applies rewriting rules to add common fields, such as the name of the machine that emitted the log, the name of the data center the machine is in, and the state of the data center that the machine is in. It then wraps the log in a JSON wrapper and forwards it to our Core data centers.
journald itself has an interesting feature that makes it difficult for some of our use cases - it guarantees a global ordering of every log on a machine. While this is convenient for the single node case, it imposes the limitation that journald is single-threaded. This means that for our heavier workloads, where every millisecond of delay counts, we provide a more direct path into our pipeline. In particular, we offer a Unix Domain Socket that syslog-ng listens on. This socket operates as a separate source of logs into the same pipeline that the journald logs follow, but allows greater throughput by eschewing the need for a global ordering that journald enforces. Logging in this manner is a bit more involved than outputting logs to the stdout streams, as services have to have a pipe created for them and then manually open that socket to write to. As such, this is generally reserved for services that need it, and don’t mind the management overhead it requires.
log-x
Our logging pipeline is a critical service at Cloudflare. Any potential delays or missing data can cause downstream effects that may hinder or even prevent the resolving of customer facing incidents. Because of this strict requirement, we have to offer redundancy in our pipeline. This is where the operation we call “log-x” comes into play.
We operate two main core data centers. One in the United States, and one in Europe. From each machine, we ship logs to both of these data centers. We call these endpoints log-a, and log-b. The log-a and log-b receivers will insert the logs into a Kafka topic for later consumption. By duplicating the data to two different locations, we achieve a level of redundancy that can handle the failure of either data center.
The next problem we encounter is that we have many data centers all around the world, which at any time due to changing Internet conditions may become disconnected from one, or both core data centers. If the data center is disconnected for long enough we may end up in a situation where we drop logs to either the log-a or log-b receivers. This would result in an incomplete view of logs from one data center and is unacceptable; Log-x was designed to alleviate this problem. In the event that syslog-ng fails to send logs to either log-a or log-b, it will actually send the log twice to the available receiver. This second copy will be marked as actually destined for the other log-x receiver. When a log-x receiver receives such a log, it will insert it into a different Kafka queue, known as the Dead Letter Queue (DLQ). We then use Kafka Mirror Maker to sync this DLQ across to the data center that was inaccessible. With this logic log-x allows us to maintain a full copy of all the logs in each core data center, regardless of any transient failures from any of our data centers.

Kafka
When logs arrive in the core data centers, we buffer them in a Kafka queue. This provides a few benefits. Firstly, it means that any consumers of the logs can be added without any changes - they only need to register with Kafka as a consumer group on the logs topic. Secondly, it allows us to tolerate transient failures of the consumers without losing any data. Because the Kafka clusters in the core data centers are much larger than any single machine, Kafka allows us to tolerate up to eight hours of total outage for our consumers without losing any data. This has proven to be enough to recover without data loss from all but the largest of incidents.
When it comes to partitioning our Kafka data, we have an interesting dilemma. Rather arbitrarily, the syslog protocol only supports timestamps up to microseconds. For our faster log emitters, this means that the syslog protocol cannot guarantee ordering with timestamps alone. To work around this limitation, we partition our logs using a key made up of both the host, and the service name. Because Kafka guarantees ordering within a partition, this means that any logs from a service on a machine are guaranteed to be ordered between themselves. Unfortunately, because logs from a service can have vastly different rates between different machines, this can result in unbalanced Kafka partitions. We have an ongoing project to move towards Open Telemetry Logs to combat this.
Onward to storage
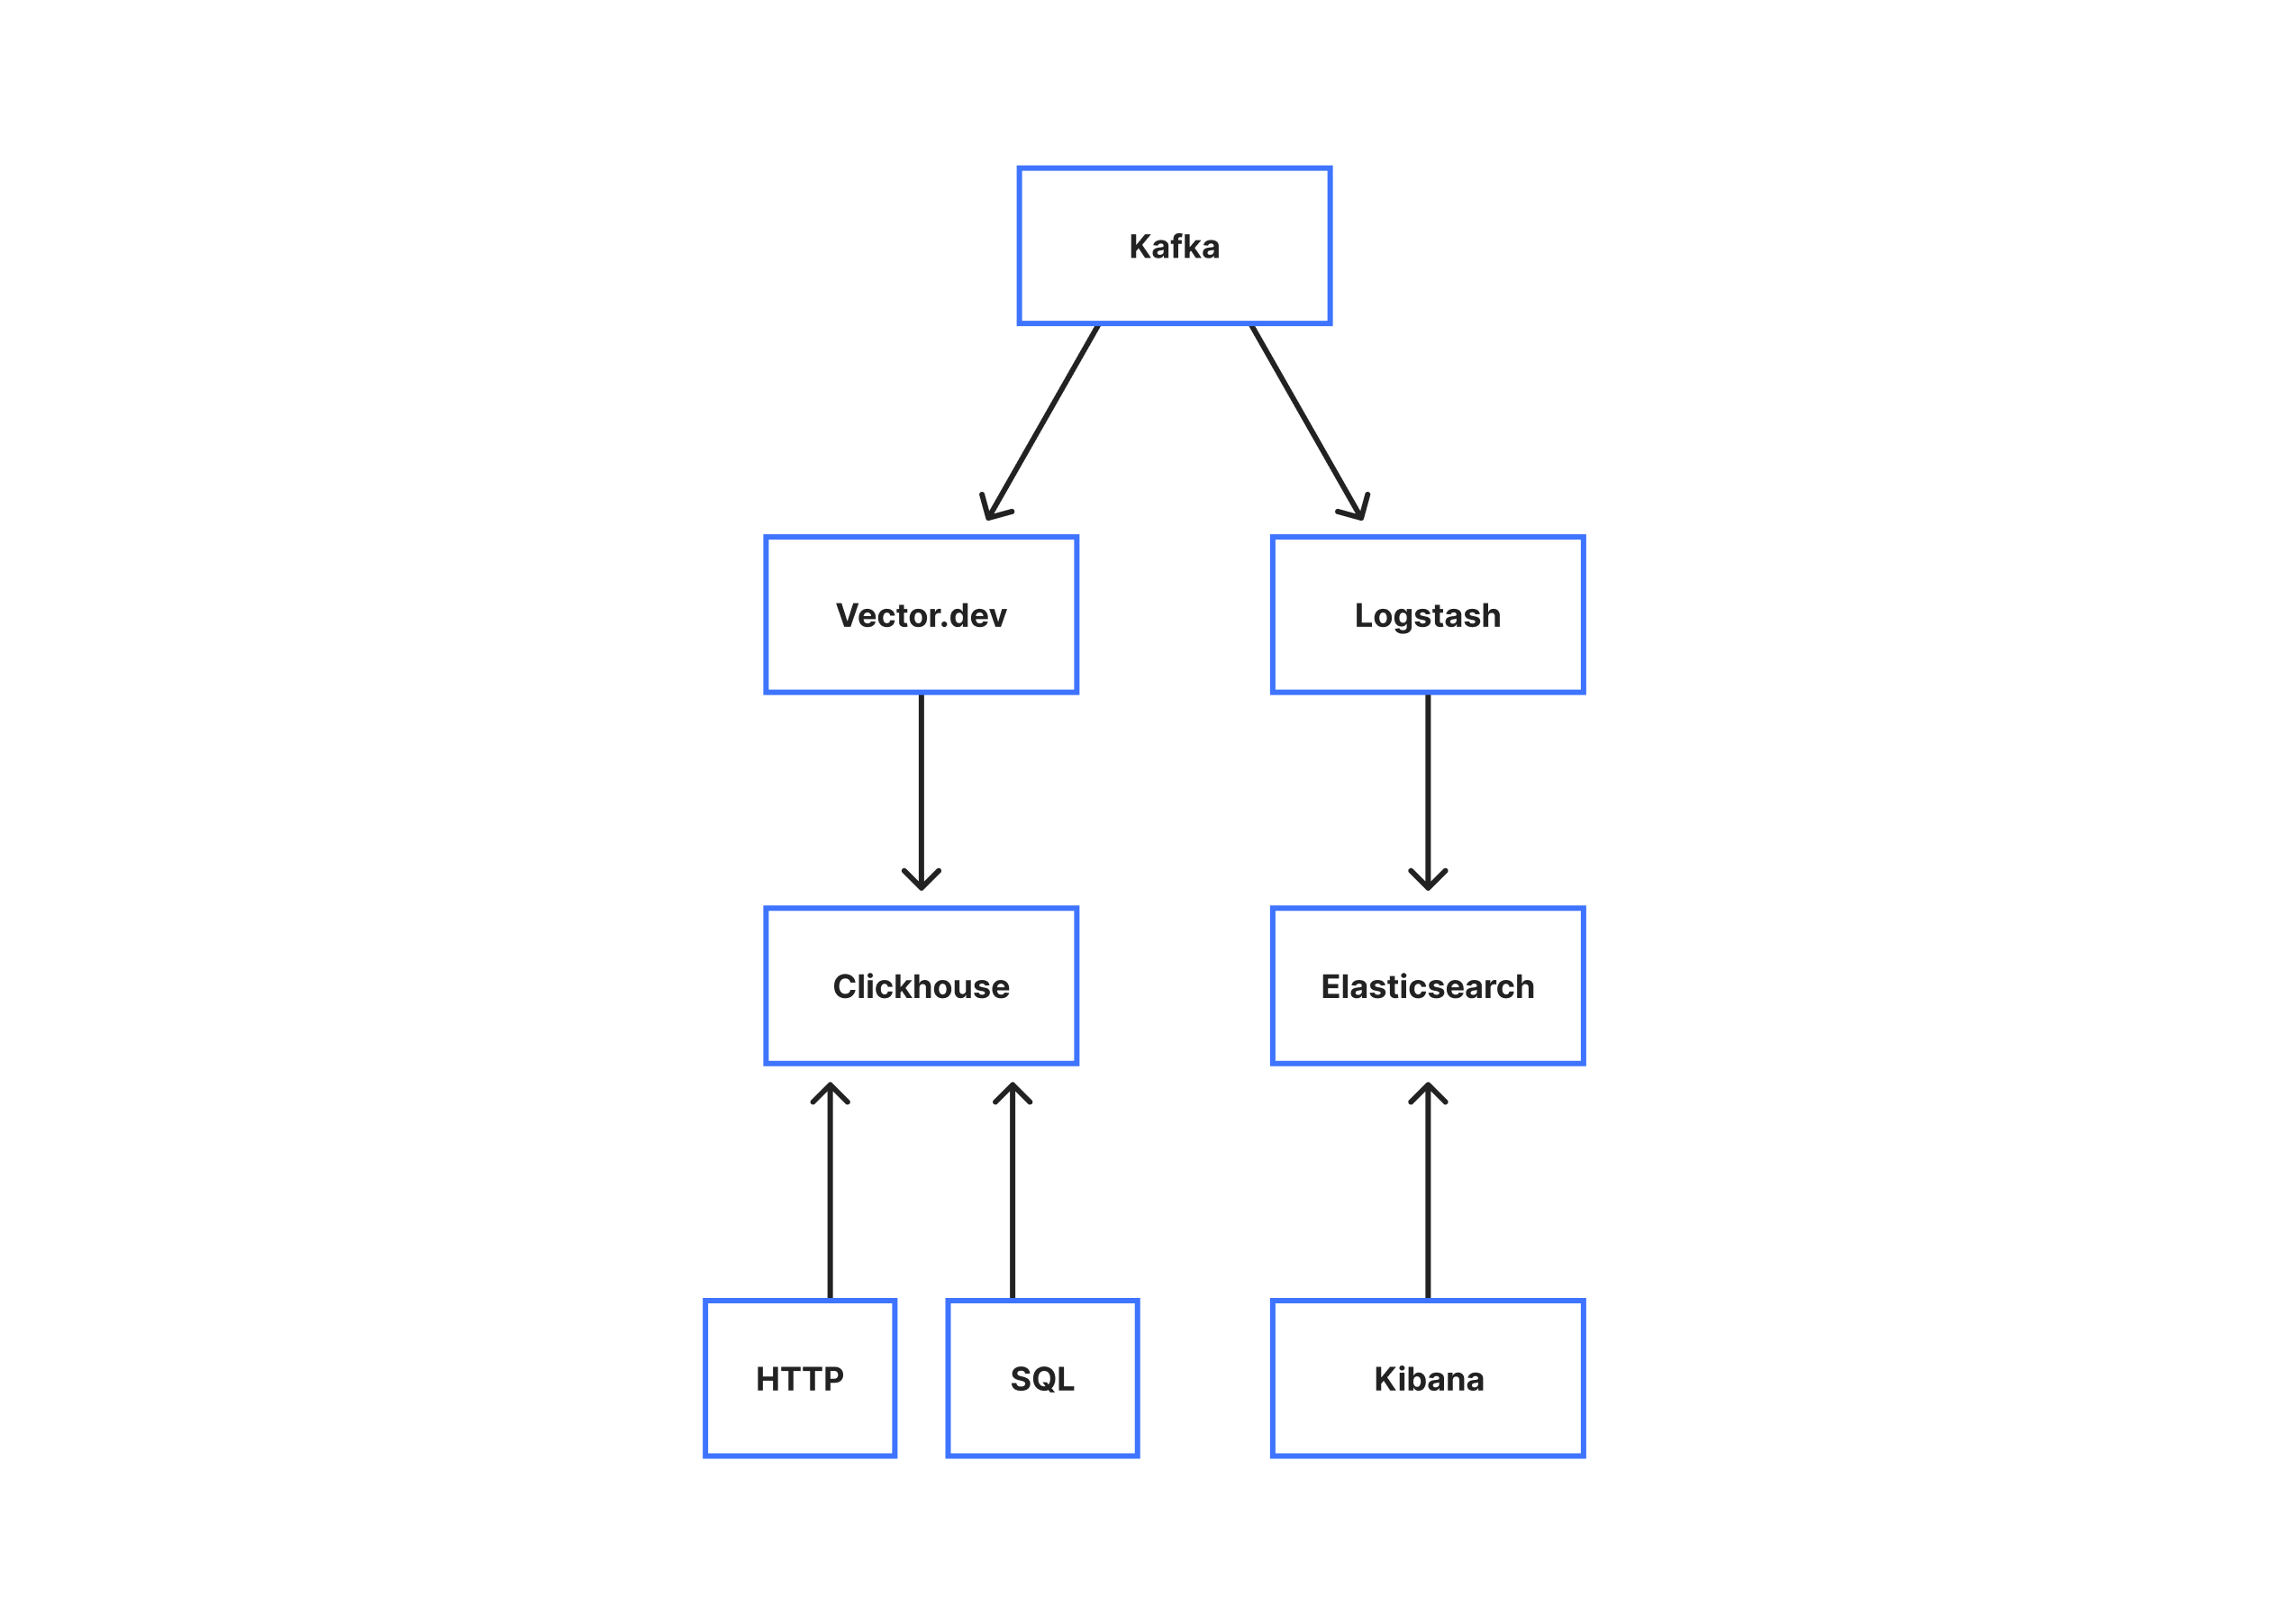
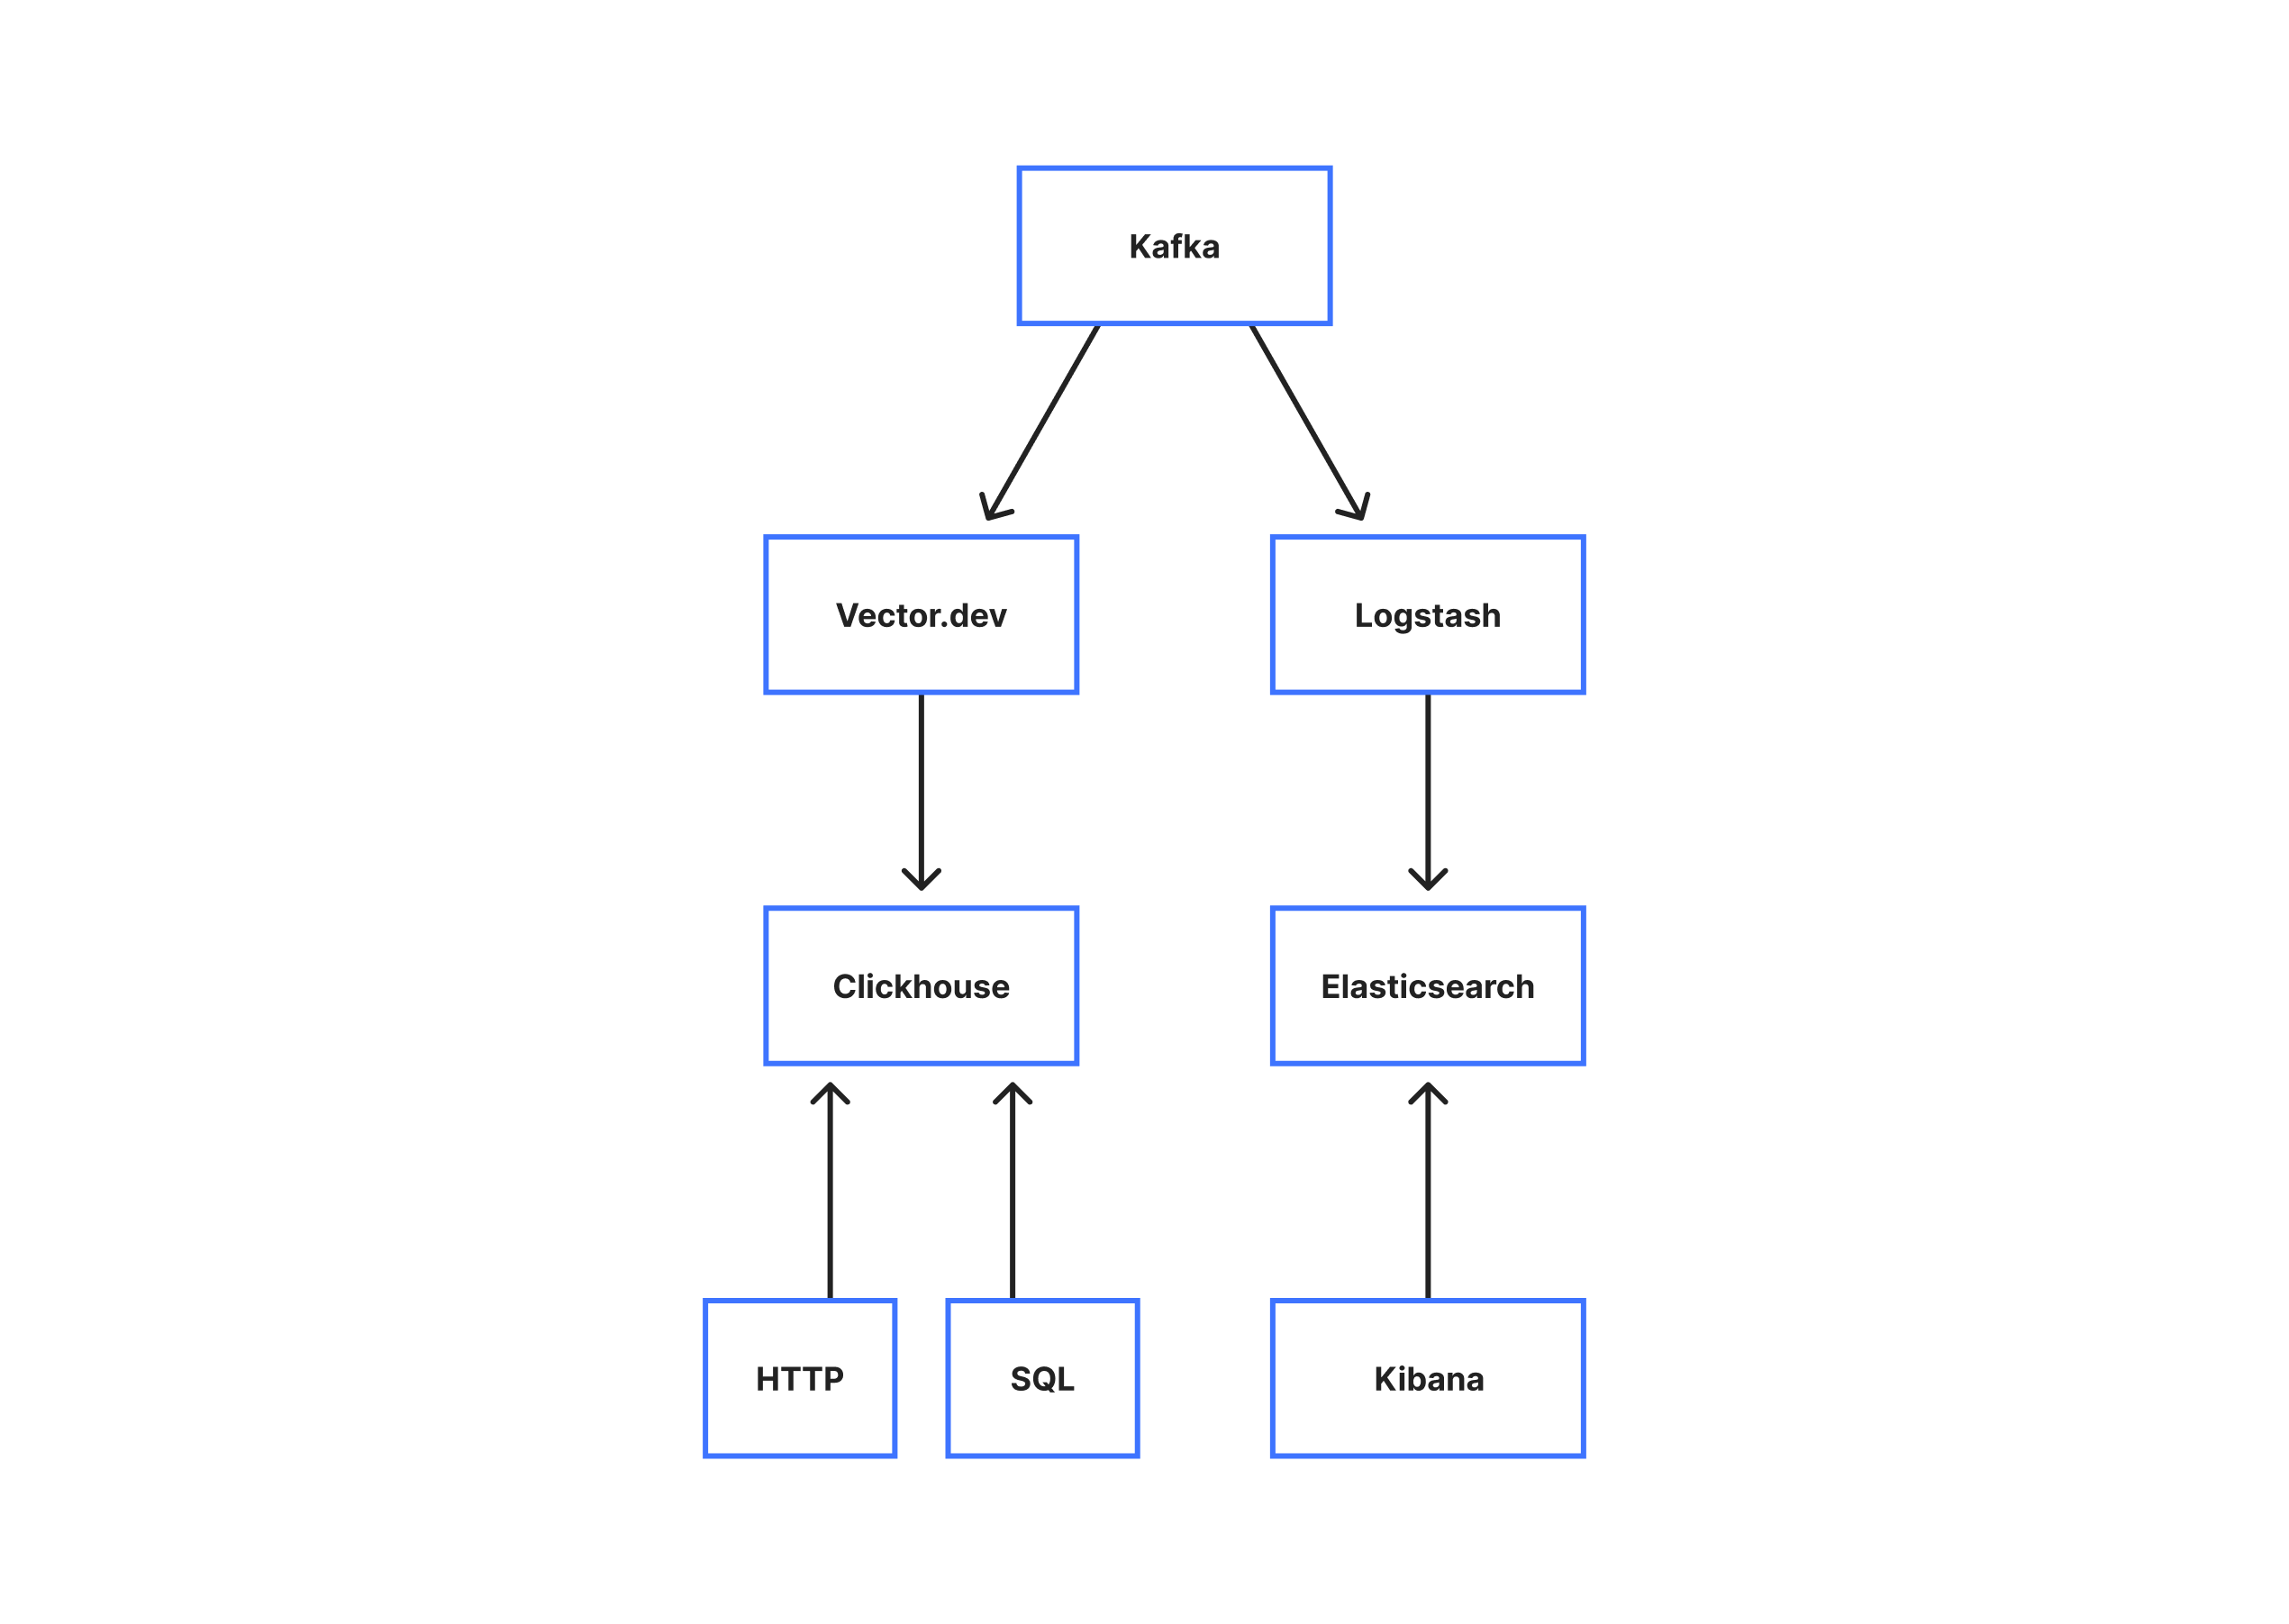
With the logs in Kafka, we can proceed to insert them into a more long term storage. For storage, we operate two backends. An ElasticSearch/Logstash/Kibana (ELK) stack, and a Clickhouse cluster.
For ElasticSearch, we split our cluster of 90 nodes into a few types. The first being “master” nodes. These nodes act as the ElasticSearch masters, and coordinate insertions into the cluster. We then have “data” nodes that handle the actual insertion and storage. Finally, we have the “HTTP” nodes that handle HTTP queries. Traditionally in an ElasticSearch cluster, all the data nodes will also handle HTTP queries, however because of the size of our cluster and shards we have found that designating only a few nodes to handle HTTP requests greatly reduces our query times by allowing us to take advantage of aggressive caching.
On the Clickhouse side, we operate a ten node Clickhouse cluster that stores our service logs. We are in the process of migrating this to be our primary storage, but at the moment it provides an alternative interface into the same logs that ElasticSearch provides, allowing our Engineers to use either Lucene through the ELK stack, or SQL and Bash scripts through the Clickhouse interface.

What’s next?
As Cloudflare continues to grow, our demands on our Observability systems, and our logging pipeline in particular continue to grow with it. This means that we’re always thinking ahead to what will allow us to scale and improve the experience for our engineers. On the horizon, we have a number of projects to further that goal including:
- Increasing our multi-tenancy capabilities with better resource insights for our engineers
- Migrating our syslog-ng pipeline towards Open Telemetry
- Tail sampling rather than our probabilistic head sampling we have at the moment
- Better balancing for our Kafka clusters
If you’re interested in working with logging at Cloudflare, then reach out - we’re hiring!
We protect entire corporate networks, help customers build Internet-scale applications efficiently, accelerate any website or Internet application, ward off DDoS attacks, keep hackers at bay, and can help you on your journey to Zero Trust.
Visit 1.1.1.1 from any device to get started with our free app that makes your Internet faster and safer.
To learn more about our mission to help build a better Internet, start here. If you're looking for a new career direction, check out our open positions.
