2024-7-10 20:21:6 Author: isc.sans.edu(查看原文) 阅读量:3 收藏
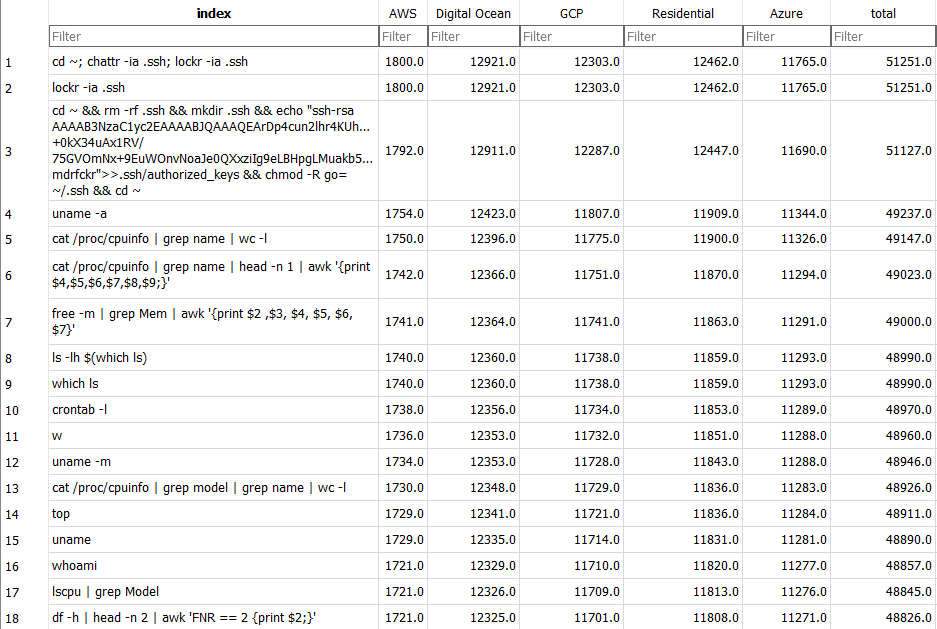
Sometimes data needs to be transformed or different tools need to be used so that it can be compared with other data. Some honeypot data is easy to compare since there is no customized information such as randomly generated file names, IP addresses, etc.
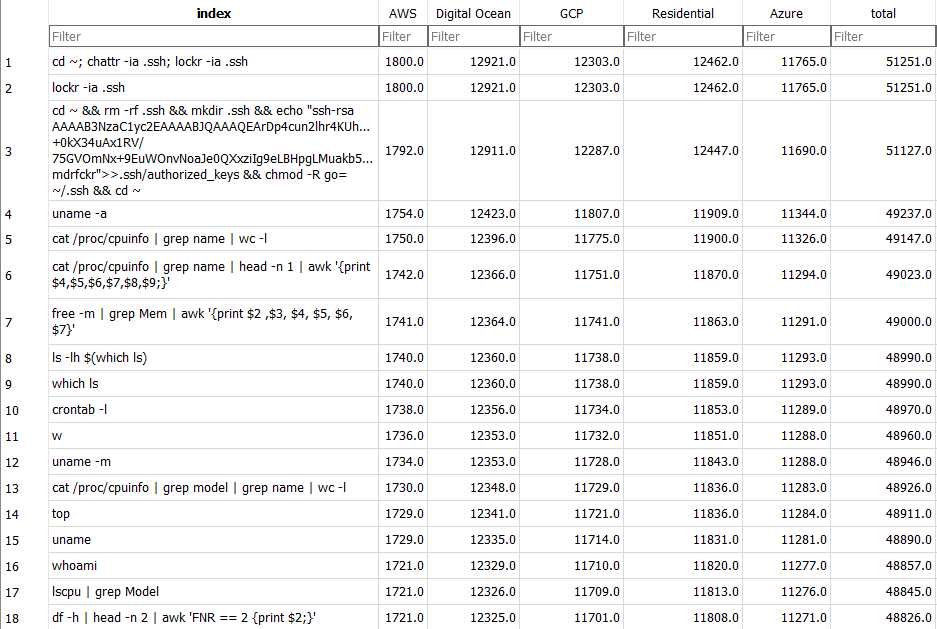
Figure 1: Common commands seen across multiple honeypots
The examples above are easy to compare and from the most commonly seen commands used, there is a large overlap seen by different honeypots. Are those the most common commands? What about commands that are very similar, but have small differences?
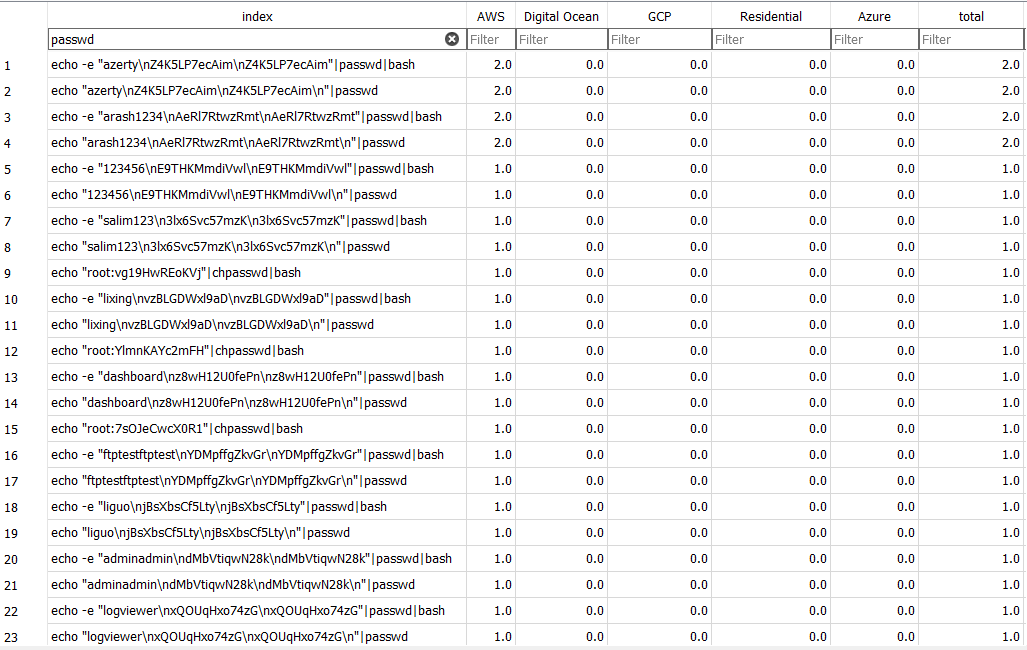
Figure 2: Commands used to change passwords, but with differences in the username or password supplied.
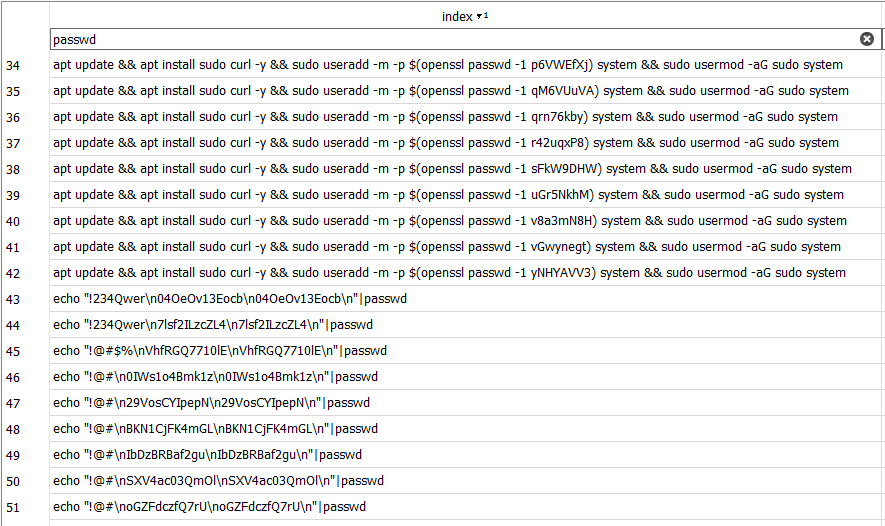
Password change attempts are just one example of commands that are very similar, with small changes in input. From the dataset, there are 77,214 instances of "passwd" being used in a command. This means that it could be the most commonly used command seen for all of the honeypots. It's been seen over 20,000 more times than the top command seen in Figure 1. From this quick filter using DB Browser for SQLite [1], very quickly a list of possibly similar commands was generated. With only 80,715 total rows, almost 97% of the commands might be password changes. An option would be to take the list as it is. Unfortunately, this can imply a grouping that may not be desired. There are some commands that also contain "passwd", but are not strictly password changes. In the example below, we see a contatenated command that includes creating a user account and setting a new password for it. It would be nice to get a list of similar commands.
Figure 3: Commands with "passwd", but fom very different commands
DBSCAN (Density-Based Spatial Clustering of Applications with Noise)
DBSCAN [2] was introduced to me in SEC 595, Applied Data Science and AI/Machine Learning for Cybersecurity Professionals [3]. To start out, I need to dermine the following:
- Dataset
- Features (features of the data that help to separate data into different clusters)
- Minimum Samples (min_samples)
- Epsilon (eps)
Dataset
To help reduce the data to be analized, a subset of the orignial data was used. Only rows with at least honeypot not having any results was extracted.
# unique_commands holds data read from SQLite file
# get any rows that contain a 0
unique_commands = commands[(commands == 0).any(axis=1)]

# 'index' is the column of commands
# extract the "index" column
unique_commands = unique_commands.loc[:, :"index"]
Features
As a starting point, I decided to see what would happen when just trying to use character frequencies as features. Some characters were selected based on what is seen within the data.
# using string to take advantage of built in character collections
import string

# create a list with all characters to count (get a frequency for)
chars_to_count = list(string.ascii_uppercase) + list(string.ascii_lowercase)
chars_to_count += [";", "\\/", "\\//", "\\=", "\\$", " ", ",", "_", ".", "\\%", "\\&"]

# add columns for each character, including the count for that character seen within each command
for each_char in chars_to_count:
    unique_commands[each_char] = unique_commands[column_label].str.count(each_char)

# Comparisons used: ['A', 'B', 'C', 'D', 'E', 'F', 'G', 'H', 'I', 'J', 'K', 'L', 'M', 'N', 'O',
# 'P', 'Q', 'R', 'S', 'T', 'U', 'V', 'W', 'X', 'Y', 'Z', 'a', 'b', 'c', 'd', 'e', 'f', 'g', 'h',
# 'i', 'j', 'k', 'l', 'm', 'n', 'o', 'p', 'q', 'r', 's', 't', 'u', 'v', 'w', 'x', 'y', 'z', ';', '\
# \/', '\\//', '\\=', '\\$', ' ', ',', '_', '.', '\\%', '\\&']
Minimum Samples and Epsilon
I decided to experimentally change "min_samples" and "eps" to see how it impacted the number of clusters created and what was created within those clusters. In general, the following is true:
- Lower "eps" = more clusters
- Lower "min_samples" = more clusters
# 3, 4, 5, 6, 7, 8, 9, 10, 11 for min_samples
minsamples_values = range(3, 11, 1)

# .5 to 2.5, incrementing by .1
eps_values = []
current_value = .5
limit = 2.5
while current_value <= limit:
    eps_values.append(current_value)
    current_value = round(current_value + .1, 1)
Cluster Differences
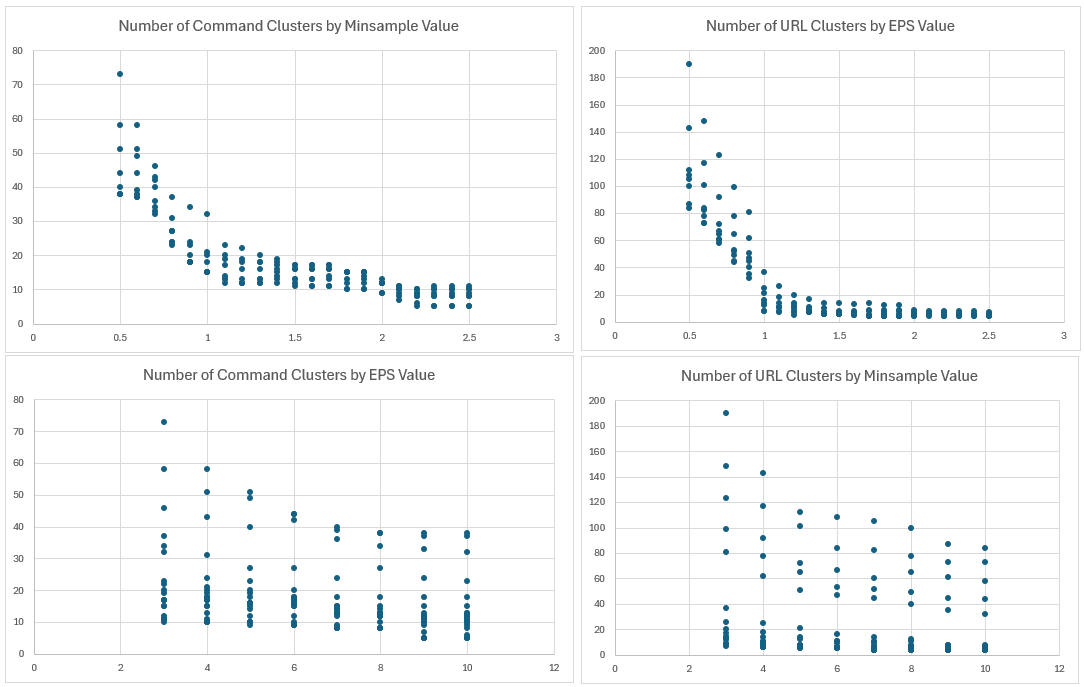
Min Number of Clusters:5
Max Number of Clusters: 73
Average: 18
Figure 4: Plot of the number of clusters formed based on "eps" and "min_samples" value changes.
Overall, the data was not surpising in thta lower "eps" values and "min_sample" values created more clusters. Let's take a look at the middle for a low "min_sample" value with a cluster size of 46 (eps=0.7, min_samples=3).
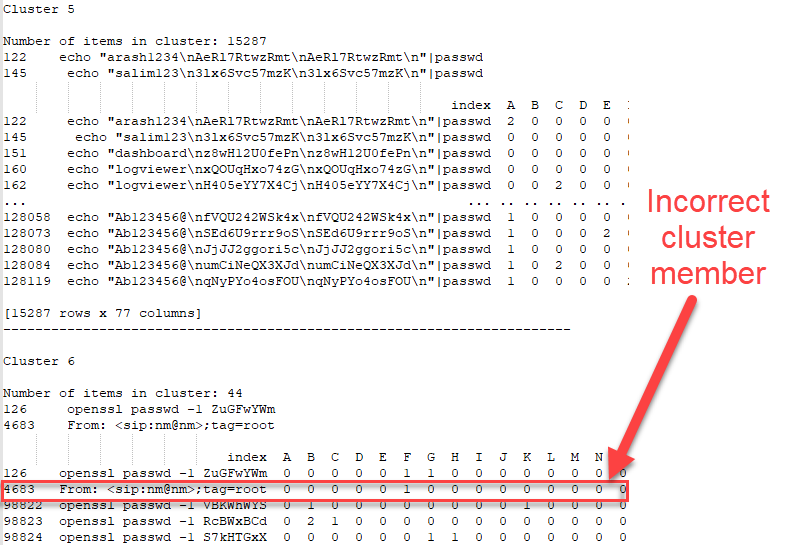
Figure 5: Except of clutered data with an incorrect cluster highlighted
Cluster 5 shows some promise in terms of the clusters being created. Cluster 6 shows an outlier but overall still looks very good. One of the challenges from the data being used is:
- High number of features
- Number of characters (len) is causing inaccurate clustering and could be weighted too high
- Some characters present in the data not being used as features ("@", "<", ">", and "=" not represented)
Changing Features
To see if changing the features could help, the features were changed and included only special characters seen within the data (numbers and letters were filtered out).
# create a dictionary that contains every character and the number of times it is represented
command_char_counts = {}
for each_item in unique_commands["index"]:
    for each_char in each_item:

        # exclude numbers
        if not each_char.isdigit():

            #exclude letters
            if not each_char in list(string.ascii_letters):
                if each_char in command_char_counts:
                    command_char_counts[each_char] += 1
                else:
                    command_char_counts[each_char] = 1

# create new columns for special characters seen within the data
for char, count in command_char_counts.items():
    if char == "." or char == "|":
        char = "\\" + char
    try:
        unique_commands[char] = unique_commands[column_label].str.count(char)
    except:
        char = "\\" + char
        unique_commands[char] = unique_commands[column_label].str.count(char)

# Comparisons used: ['/', '>', '@', "'", '#', '!', ';', '=', '$', ':', '\\.', '-', '\\+', '"', '\\
# \\', '\\|', '\\?', '&', '^', '%', '\\[', ']', '<', '\\(', '\\)', ',', '_', '\\*', '{', '}',
# '\n', '~']
This strategy seems like it would help since it is less overall features. Unfortunately, I ran into memory errors after hitting an eps of 1.3.
- min_samples = 3, eps = 1.2 --> worked
- min_samples = 3, eps = 1.3 --> memory error on dbscan.fit(reduced)
Since I ran into issues where I could automate a variety of "min_samples" and "eps" values, I decided to try to change features again, aiming for even less features.
Changing Features (again)
Based on some of the commands contained within the data, the following features were selected:
- "appends" (contatenated commands, containing " && ")
- "args1" (command arguments starting with "+")
- "args2" (command arguements starting with "-")
- "outputs" (commands with output " > ")
- "conditionals" (commands with " if ")
- "command_parts" (number of individual commands separated by semicolon ";")
- "length" (total command length)
- "partn_length (length of the last part, separated by semicolon ";")
- "partn_minus_1_length" (length of the second last part, separated by semicolon ";")
- "partn_minus_2_length" (length of the third last part, separated by semicolon ";")
def find_pattern_instance_num(string, pattern):
    return len(re.findall(rf'.*({pattern}).*', string))

def find_part_num(string, splitchars):
    return len(string.split(splitchars))

def find_part_length(string, splitchars, segment):
    try:
        return len(string.split(splitchars)[segment])
    except:
        return 0

appends = [find_pattern_instance_num(index, " && ") for index in unique_commands[column_label]]
args1 = [find_pattern_instance_num(index, " +[A-Za-z] ") for index in unique_commands[column_label]]
args2 = [find_pattern_instance_num(index, " -[A-Za-z] ") for index in unique_commands[column_label]]
outputs = [find_pattern_instance_num(index, " > ") for index in unique_commands[column_label]]
conditionals = [find_pattern_instance_num(index, " if ") for index in unique_commands[column_label]]
command_parts = [find_part_num(index, ";") for index in unique_commands[column_label]]
length = [len(index) for index in unique_commands[column_label]]
partn_length = [find_part_length(index, ';', -1) for index in unique_commands[column_label]]
partn_minus_1_length = [find_part_length(index, ';', -2) for index in unique_commands[column_label]]
partn_minus_2_length = [find_part_length(index, ';', -3) for index in unique_commands[column_label]]

unique_commands["appends"] = appends
unique_commands["args1"] = args1
unique_commands["args2"] = args2
unique_commands["outputs"] = outputs
unique_commands["conditionals"] = conditionals
unique_commands["command_parts"] = command_parts
unique_commands["length"] = length
unique_commands["partn_length"] = partn_length
unique_commands["partn_minus_1_length"] = partn_minus_1_length
unique_commands["partn_minus_2_length"] = partn_minus_2_length
Min Number of Clusters:10
Max Number of Clusters: 113
Average: 34.75
Data reviewed: eps = .5, min_samples = 9, clusters = 46
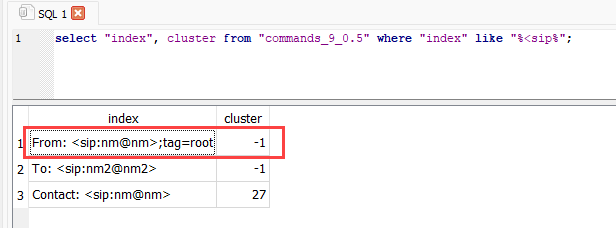
Looking at the original outlier it appears that it is now in cluster "-1", meaning it is grouped as an outlier.
Figure 6: Data previously group incorrectly into a cluster now shown as an outlier
This doesn't mean that the clusters perfect or even more accurate overall, but it does show the impact when changing features and other DBSCAN variables. Experimenting with different values can be helpeful when trying to determine the best settings for your data analysis.
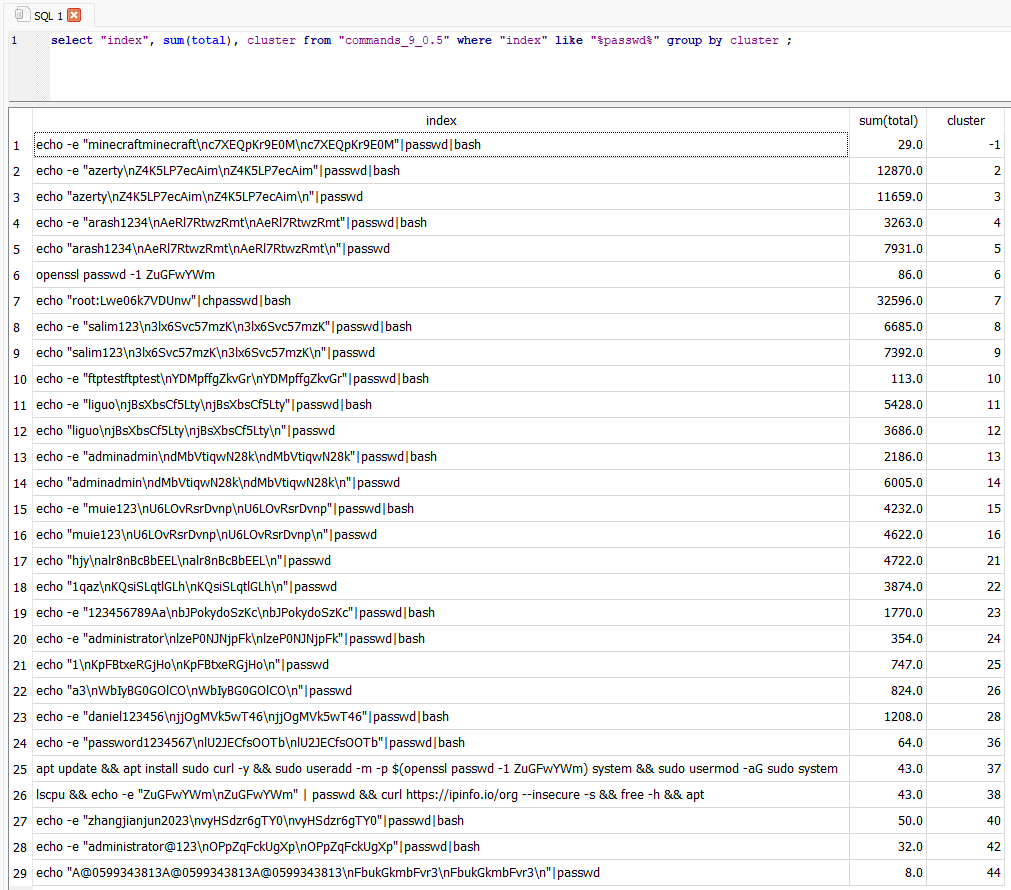
Looking back at the original problem, how did things sort out with different commands containing "passwd"?
Figure 7: Commands listed with their associated cluster and total items seen per cluster.
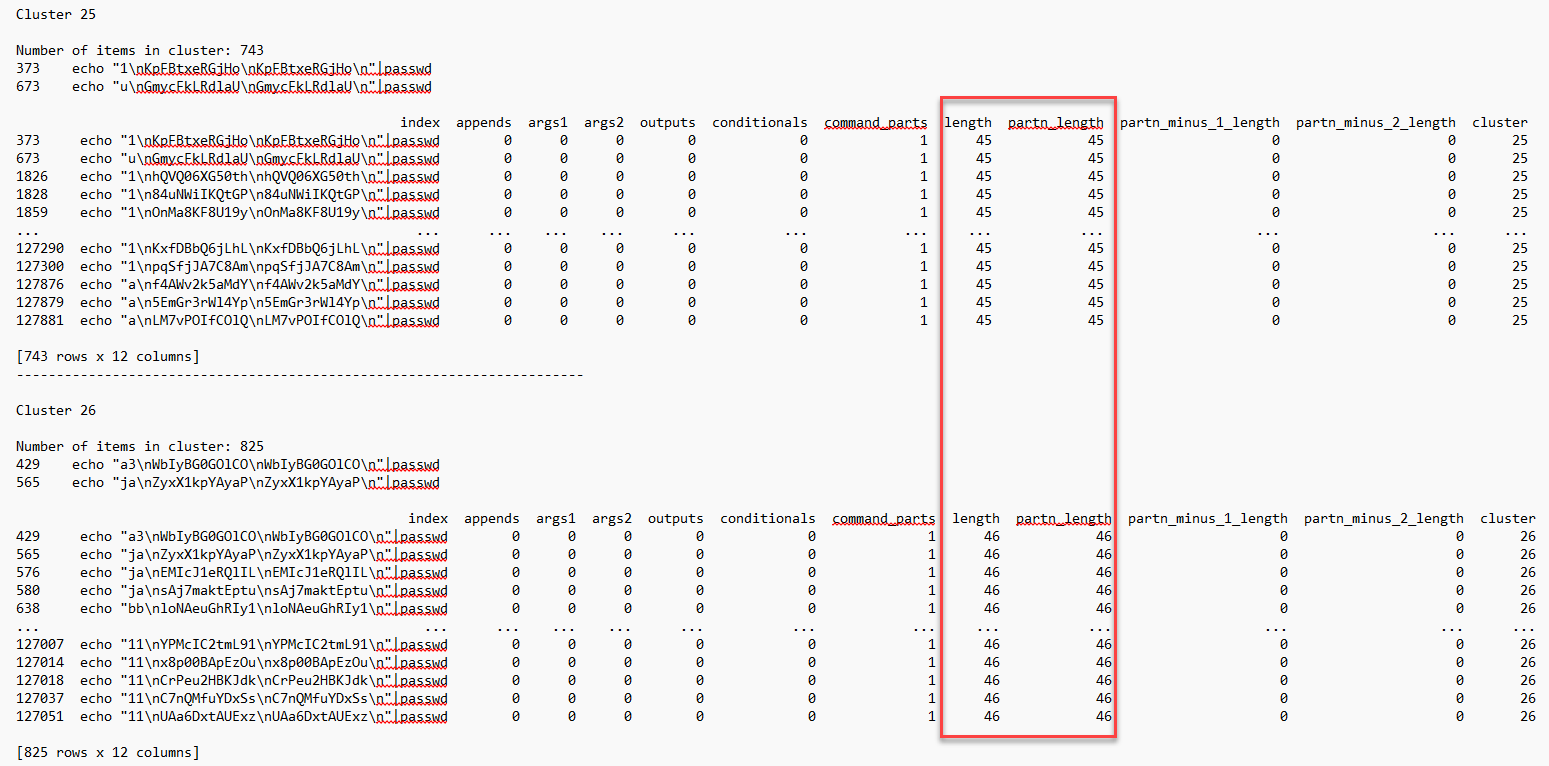
The original command that was an issue (cluster 37) is now separated. There are more clusters than desired for the password password change attempts starting with "echo". This could still be classified manually since there are a low number of clusters. The issue here is that the only value being used to cluster this data is the length of the command itself.
Figure 8: Password change cluster showing length as the clustering feature
We'll see where this ends up, but some good things to keep in mind when performing clustering:
- Experiment with different eps, min_samples and features
- Save data to review later so that it can be used to further tailor your variables
- Putting some thought into features can help tremendously, but it requires understanding the data
[1] https://sqlitebrowser.org/
[2] https://scikit-learn.org/dev/auto_examples/cluster/plot_dbscan.html
[3] https://www.sans.org/cyber-security-courses/applied-data-science-machine-learning/
--
Jesse La Grew
Handler
如有侵权请联系:admin#unsafe.sh
