Imagine halving the resource costs of AI and what that could mean for the planet and the industry -- based on extreme estimates such savings could reduce the total US power usage by over 10% by 20301. At Intel we've been creating a new analyzer tool to help reduce AI costs called AI Flame Graphs: a visualization that shows an AI accelerator or GPU hardware profile along with the full software stack, based on my CPU flame graphs. Our first version is available to customers in the Intel Tiber AI Cloud as a preview for the Intel Data Center GPU Max Series (previously called Ponte Vecchio). Here is an example:
Simple example: SYCL matrix multiply microbenchmark
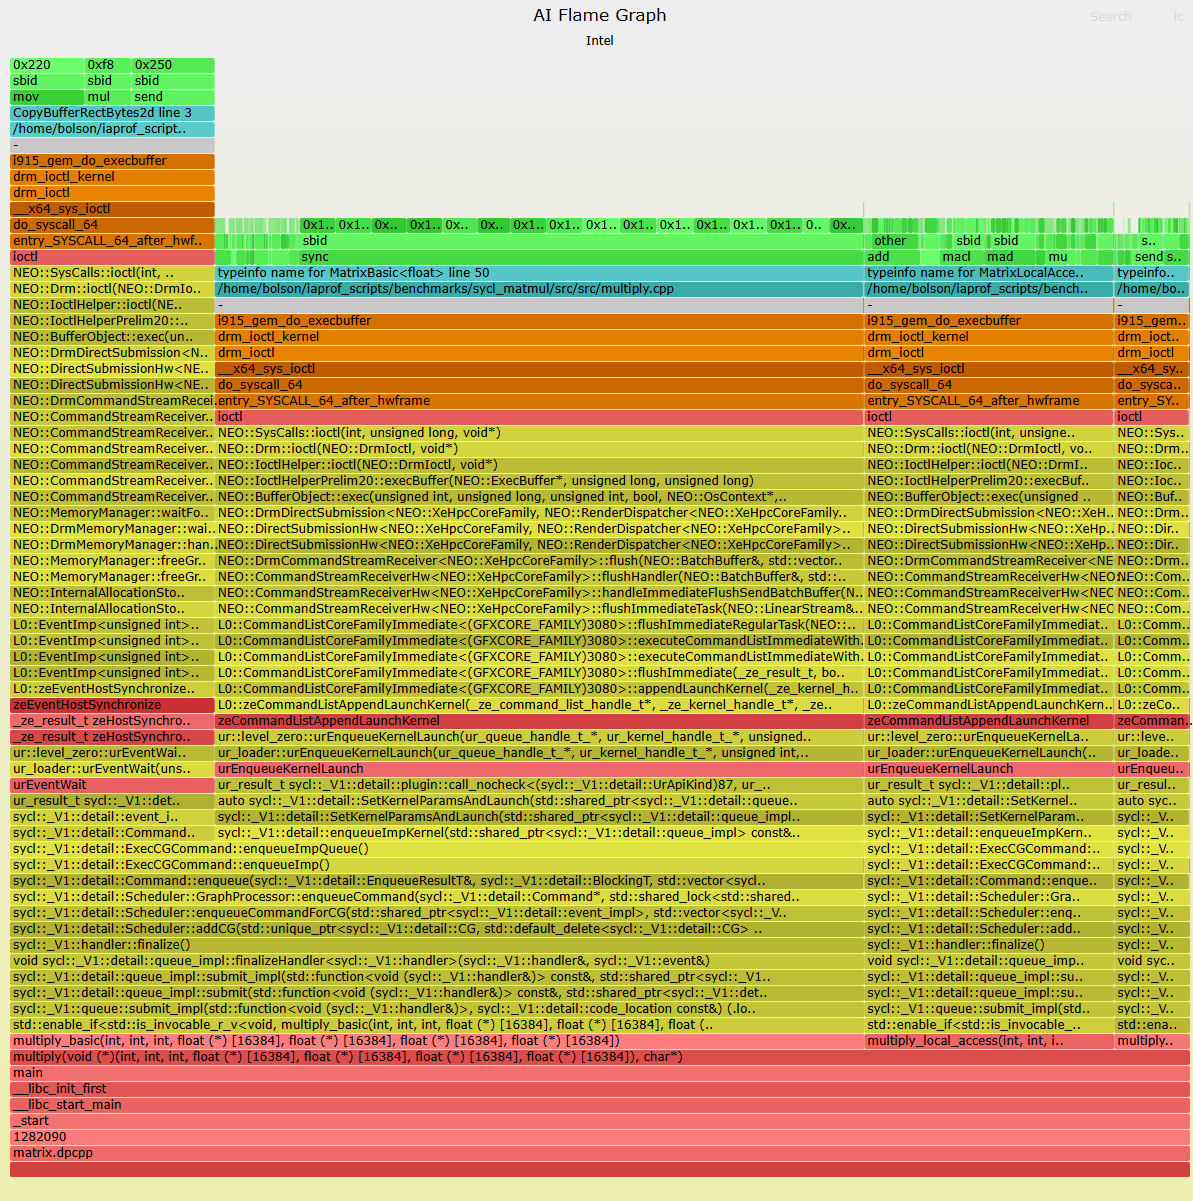
(Click for interactive SVG.) The green frames are the actual instructions running on the AI or GPU accelerator, aqua shows the source code for these functions, and red (C), yellow (C++), and orange (kernel) show the CPU code paths that initiated these AI/GPU programs. The gray "-" frames just help highlight the boundary between CPU and AI/GPU code. The x-axis is proportional to cost, so you look for the widest things and find ways to reduce them.
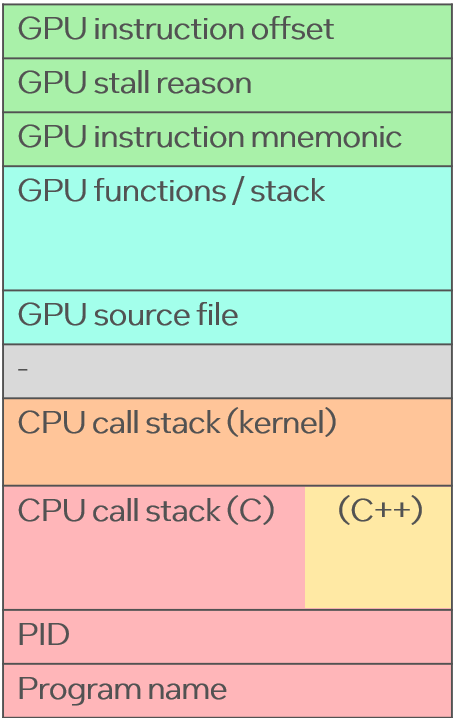
Layers
This flame graph shows a simple program for SYCL (a high-level C++ language for accelerators) that tests three implementations of matrix multiply, running them with the same input workload. The flame graph is dominated by the slowest implementation, multiply_basic(), which doesn't use any optimizations and consumes at 72% of stall samples and is shown as the widest tower. On the right are two thin towers for multiply_local_access() at 21% which replaces the accessor with a local variable, and multiply_local_access_and_tiling() at 6% which also adds matrix tiling. The towers are getting smaller as optimizations are added.
This flame graph profiler is a prototype based on Intel EU stall profiling for hardware profiling and eBPF for software instrumentation. It's designed to be easy and low-overhead, just like a CPU profiler. You should be able to generate a flame graph of an existing AI workload whenever you want, without having to restart anything or launch additional code via an interposer.
Instruction-offset Profiling
This is not the first project to build an AI profiler or even something called an AI Flame Graph, however, others I've seen focus on tracing CPU stacks and timing accelerator execution, but don't profile the instruction offsets running on the accelerator; or do profile them but via expensive binary instrumentation. I wanted to build AI flame graphs that work like CPU flame graphs: Easy to use, negligible cost, production safe, and shows everything. A daily tool for developers, with most of the visualization in the language of the developer: source code functions.
This has been an internal AI project at Intel for the past year. Intel was already investing in this space, building the EU stall profiler capability for the Intel Data Center GPU Max Series that provides an approximation of HW instruction sampling. I was lucky to have Dr. Matthew (Ben) Olson, an Intel AI engineer who has also worked on eBPF performance tooling (processwatch) as well as memory management research, join my team and do most of the development work. His background has helped us power through difficulties that seemed insurmountable. We've also recently been joined by Dr. Brandon Kammerdiener (coincidentally another graduate of the University of Tennessee, like Ben), who also has eBPF and memory internals experience, and has been helping us take on harder and harder workloads. And Gabriel Muñoz just joined today to help with releases. Now that our small team has shown that this is possible, we'll be joined by other teams at Intel to develop this further.
We could have built a harder-to-use and higher-overhead version months ago using Intel GTPin but for widespread adoption it needs minimal overhead and ease of use so that developers don't hesitate to use this daily and to add it to deployment pipelines.
What's a Flame Graph?
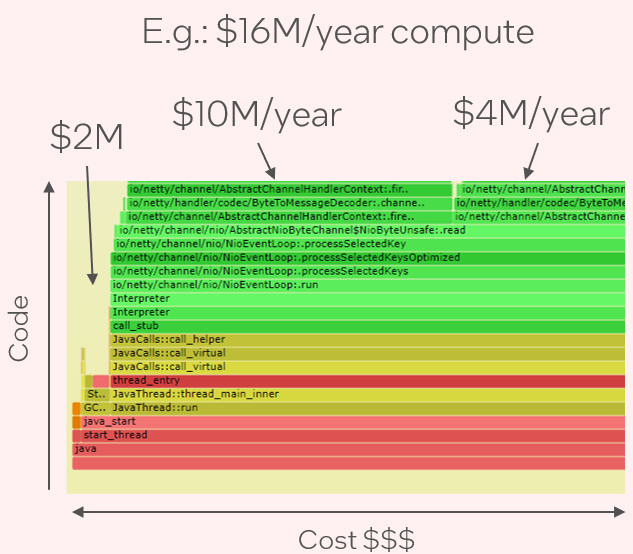
A flame graph is a visualization I invented in 2011 for showing sampled code stack traces. It has become the standard for CPU profiling and analysis, helping developers quickly find performance improvements and eliminate regressions. A CPU flame graph shows the "big picture" of running software, with x-axis proportional to CPU cost. The example picture on the right summarizes how easy it can be to go from compute costs to responsible code paths. Prior to flame graphs, it could take hours to understand a complex profile by reading through hundreds of pages of output. Now it takes seconds: all you have to do is look for the widest rectangles.
Flame graphs have had worldwide adoption. They have been the basis for five startups so far, have been adopted in over thirty performance analysis products, and have had over eighty implementations.
My first implementation of flame graphs took a few hours on a Wednesday night after work. The real effort has been in the decade since, where I worked with different profilers, runtimes, libraries, kernels, compilers, and hypervisors to get flame graphs working properly in different environments, including fixing stack walking and symbolization. Earlier this year I posted about the final missing piece: Helping distros enable frame pointers so that profiling works across standard system libraries.
Similar work is necessary for AI workloads: fixing stacks and symbols and getting profiling to work for different hardware, kernel drivers, user-mode drivers, frameworks, runtimes, languages, and models. A lot more work, too, as AI analysis has less maturity than CPU analysis.
Searching Samples
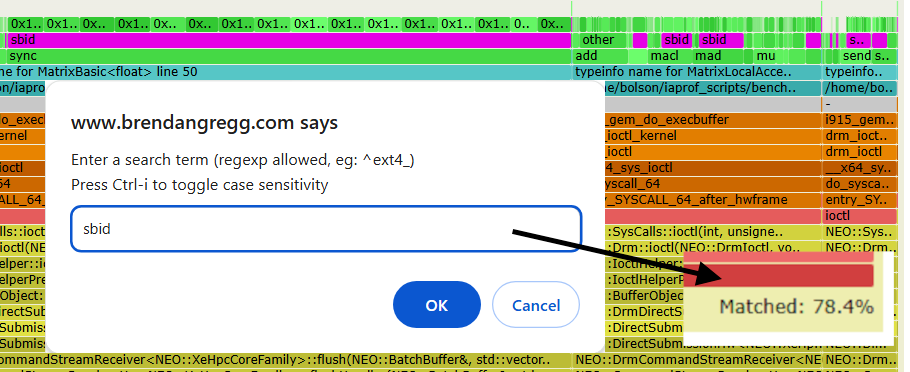
If you are new to flame graphs, it's worth highlighting the built-in search capability. In the earlier example, most of the stall samples are caused by sbid: software scoreboard dependency. As that may be a unique search term, you can run search (Ctrl-F, or click "Search") on "sbid" and it will highlight it in magenta:

Search also shows the total number of stack samples that contained sbid in the bottom right: 78.4%. You can search for any term in the flame graph: accelerator instructions, source paths, function names, etc., to quickly calculate the percentage of stacks where it is present (excluding vertical overlap) helping you prioritise performance work.
Note that the samples are EU stall-based, which means theoretical performance wins can take the percentages down to zero. This is different to timer-based samples as are typically used in CPU profiling. Stalls mean you better focus on the pain, the parts of the code that aren't making forward progress, but you aren't seeing resource usage by unstalled instructions. I'd like to supuport timer-based samples in the future as well, so we can have both views.
Who will use this?
At a recent golang conference, I asked the audience of 200+ to raise their hands if they were using CPU flame graphs. Almost every hand went up. I know of companies where flame graphs are a daily tool that developers use to understand and tune their code, reducing compute costs. This will become a daily tool for AI developers.
My employer will use this as well for evaluation analysis, to find areas to tune to beat competitors, as well as to better understand workload performance to aid design.
Why is AI profiling hard?
Consider CPU instruction profiling: This is easy when the program and symbol table are both in the file system and in a standardized file format (such as ELF) as is the case with native compiled code (C). CPU profiling gets hard for JIT-complied code, like Java, as instructions and symbols are dynamically generated and placed in main memory (the process heap) without following a universal standard. For such JITted code we use runtime-specific methods and agents to retrieve snapshots of the heap information, which is different for each runtime.
AI workloads also have different runtimes (and frameworks, languages, user-mode drivers, compilers, etc.) any of which can require special tinkering to get their CPU stacks and symbols to work. These CPU stacks are shown as the red, orange, and yellow frames in the AI Flame Graph. Some AI workloads are easy to get these frames working, some (like PyTorch) are a lot more work.

But the real challenge is instruction profiling of actual GPU and AI accelerator programs -- shown as the aqua and green frames -- and correctly associating them with the CPU stacks beneath them. Not only may these GPU and AI programs not exist in the file system, but they may not even exist in main memory! Even for running programs. Once execution begins, they may be deallocated from main memory and only exist in special accelerator memory, beyond the direct reach of OS profilers and debuggers. Or within reach, but only through a prohibitively high-overhead HW-specific debugger interface.
There's also no /proc representation for these programs either (I've been proposing building an equivalent) so there's no direct way to even tell what is running and what isn't, and all the other /proc details. Forget instruction profiling, even ps(1) and all the other process tools do not work.
It's been a mind-bending experience, revealing what gets taken for granted because it has existed in CPU land for decades: A process table. Process tools. Standard file formats. Programs that exist in the file system. Programs running from main memory. Debuggers. Profiliers. Core dumping. Disassembling. Single stepping. Static and dynamic instrumentation. Etc. For GPUs and AI, this is all far less mature. It can make the work exciting at times, when you think something is impossible and then find or devise a way.
Fortunately we have a head start as some things do exist. Depending on the runtime and kernel driver, there are debug interfaces where you can list running accelerator programs and other statistics, as used by tools like intel_gpu_top(1). You can kill -9 a GPU workload using intel_gpu_abrt(1). Some interfaces can even generate basic ELF files for the running accelerator programs that you can try to load in a debugger like gdb(1). And there is support for GPU/AI program disassembly, if you can get your hands on the binary. It feels to me like GPU/AI debugging, OS style, is about two years old. Better than zero, but still early on, and lots more ahead of us. A decade, at least.
What do AI developers think of this?
We've shown AI Flame Graphs to other AI developers at Intel and a common reaction is to be a bit puzzled, wondering what to do with it. AI developers think about their bit of code, but with AI Flame Graphs they can now see the entire stack for the first time, including the HW, and many layers they don't usually think about or don't know about. It basically looks like a pile of gibberish with their code only a small part of the flame graph.
This reaction is similar to people's first experiences with CPU flame graphs, which show parts of the system that developers and engineers typically don't work on, such as runtime internals, system libraries, and kernel internals. Flame graphs are great at highlighting the dozen or so functions that matter the most, so it becomes a problem of learning what those functions do across a few different code bases, which are typically open source. Understanding a dozen such functions can take a few hours or even a few days -- but if this leads to a 10% or 2x cost win, it is time well spent. And the next time the user looks at a flame graph, they start saying "I've seen that function before" and so on. You can get to the point where understanding the bulk of a CPU flame graph takes less than a minute: look for the widest tower, click to zoom, read the frames, done.
I'm encouraged by the success of CPU flame graphs, with over 80 implementations and countless real world case studies. Sometimes I'm browsing a performance issue I care about on github and hit page down and there's a CPU flame graph. They are everywhere.
I expect AI developers will also be able to understand AI Flame Graphs in less than a minute, but to start with people will be spending a day or more browsing code bases they didn't know were involved. Publishing case studies of found wins will also help people learn how to interpret them, and also help explain the value.
What about PyTorch?
Another common reaction we've had is that AI developers are using PyTorch, and initially we didn't support it as it meant walking Python stacks, which isn't trivial. But prior work has been done there (to support CPU profiling) and after a lot of tinkering we now have the first PyTorch AI Flame Graph:
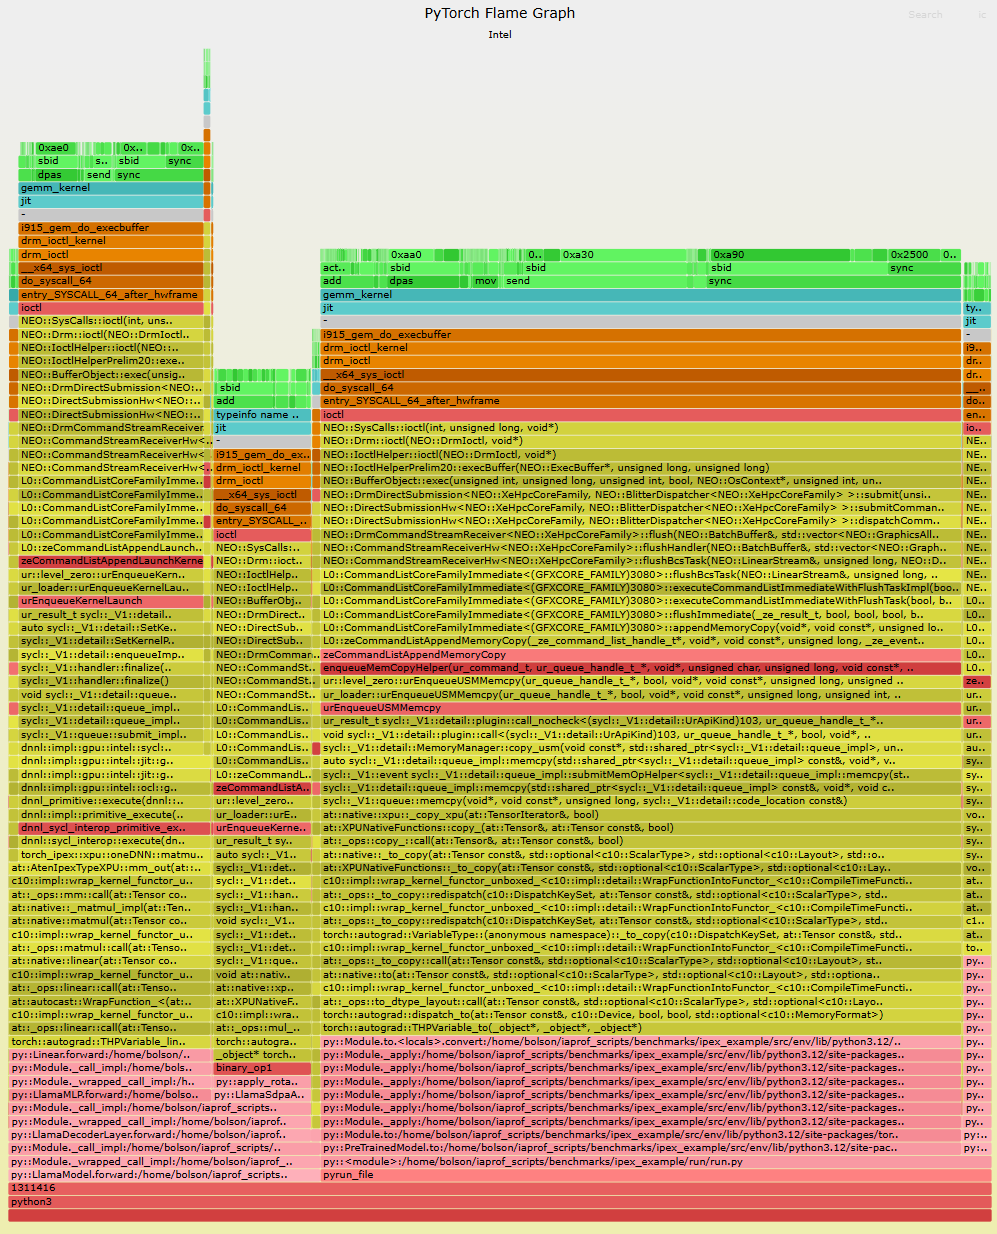
PyTorch frames in pink
(Click for interactive SVG.) The PyTorch functions are at the bottom and are colored pink. This example runs oneDNN kernels that are JIT-generated, and don't have a source path so that layer just reads "jit". Getting all other the layers included was a real pain to get going, but an important milestone. We think if we can do PyTorch we can do anything.
In this flame graph, we show PyTorch running the Llama 2 7B model using the Intel Extensions for PyTorch (IPEX). This flame graph shows the origin of the GPU kernel execution all the way back to the Python source code shown in pink. Most samples are from a stack leading up to a gemm_kernel (matrix multiply) shown in aqua, which like the previous example has many stalls due to software scoreboarding.
There are two instructions here (0xa30 and 0xa90) that combined are 27% of the entire profile. I expect someone will ask: Can't we just click on instructions and have it bring up a dissassembly view with full source? Yes, that should be possible, but I can't answer how we're going to provide this yet. Another expected question I can't yet answer: Since there are now multiple products providing AI auto-tuning of CPU workloads using CPU flame graphs (including Intel Granulate) can't we have AI auto-tuning of AI workloads using AI Flame Graphs?
First Release: Sometimes hard and with moderate overhead
Getting AI Flame Graphs to work with some workloads is easy, but others are currently hard and cost moderate overhead. It's similar to CPU profiling, where some workloads and languages are easy to profile, whereas others need various things fixed. Some AI workloads use many software dependencies that need various tweaks and recompilation (e.g., enabling frame pointers so that stack walking works) making setup time consuming. PyTorch is especially difficult and can take over a week of OS work to be ready for AI Flame Graphs. We will work on getting these tweaks changed upstream in their respective repositories, something involving teams inside and outside of Intel, and is a process I'd expect to take at least a year. During that time AI workloads will gradually become easier to flame graph, and with lower-overhead as well.
I'm reminded of eBPF in the early days: You had to patch and recompile the kernel and LLVM and Clang, which could take multiple days if you hit errors. Since then all the eBPF dependency patches have been merged, and default settings changed, so that eBPF "just works." We'll get there with AI Flame Graphs too, but right now it's still those early days.
The changes necessary for AI Flame Graphs are really about improving debugging in general, and are a requirement for Fast by Friday: A vision where we can root-cause analyze anything in five days or less.
Availability
AI Flame Graphs will first become available on the Intel Tiber AI Cloud as a preview feature for the Intel Data Center GPU Max Series. If you are currently deployed there you can ask through the Intel service channel for early access. As for if or when it will support other hardware types, be in other Intel products, be officially launched, be open source, etc., these involve various other teams at Intel and they need to make their own announcements before I can discuss them here.
Conclusions
Finding performance improvements for AI data centers of just fractions of a percent can add up to planetary savings in electricity, water, and money. If AI flame graphs have the success that CPU flame graphs have had, I'd expect finding improvements of over 10% will be common, and 50% and higher will eventually be found*. But it won't be easy in these early days as there are still many software components to tweak and recompile, and software layers to learn about that are revealed in the AI flame graph.
In the years ahead I imagine others will build their own AI flame graphs that look the same as this one, and there may even be startups selling them, but if they use more difficult-to-use and higher-overhead technologies I fear they could turn companies off the idea of AI flame graphs altogether and prevent them from finding sorely needed wins. This is too important to do badly. AI flame graphs should be easy to use, cost negligible overhead, be production safe, and show everything. Intel has proven it's possible.
Disclaimer
* This is a personal blog post that makes personal predictions but not guarantees of possible performance improvements. Feel free to take any claim with a grain of salt, and feel free to wait for an official publication and public launch by Intel on this technology.
1 Based on halving the Arm CEO Rene Haas' estimate of 20-25% quoted in Taking a closer look at AI's supposed energy apocalypse by Kyle Orland of ArsTechnica.
Thanks
Thanks to everyone at Intel who have helped us make this happen. Markus Flierl has driven this project and made it a top priority, and Greg Lavender has expressed his support. Special thanks to Michael Cole, Matthew Roper, Luis Strano, Rodrigo Vivi, Joonas Lahtinen, Stanley Gambarin, Timothy Bauer, Brandon Yates, Maria Kraynyuk, Denis Samoylov, Krzysztof Raszknowski, Sanchit Jain, Po-Yu Chen, Felix Degrood, Piotr Rozenfeld, Andi Kleen, and all of the other coworkers that helped clear things up for us, and thanks in advance for everyone else who will be helping us in the months ahead.
My final thanks is to the companies and developers who do the actual hands-on work with flame graphs, collecting them, examining them, finding performance wins, and applying them.
You are helping save the planet.
如有侵权请联系:admin#unsafe.sh
