Last update: Sept 30, 2020Earlier this year, I shared a post on how you can become an expert 2020-09-30 07:49:32 Author: textslashplain.com(查看原文) 阅读量:289 收藏
Last update: Sept 30, 2020
Earlier this year, I shared a post on how you can become an expert on web browsers from the comfort of your desk… or anywhere else you have an internet connection. In that post, I mostly covered how to search through the source, review issue reports, and find design documentation. I also provided a long list of browser experts you might consider following on Twitter.
In today’s post, I’d like to give a quick summary of some of the tools and techniques I use for diagnosing browser problems.
The Importance of Observation
Specs lie. Code misleads. Observation reveals what’s actually going on– not what the PM designed, or the Dev intended.
In many cases, the fastest route to troubleshoot problems is to observe exactly what is happening on the network, disk, or screen and only then start looking at code and specs to figure out why.
Built-in Tools
The F12 Developer Tools (just hit F12) are tremendously useful for determining why a given website behaves in a certain way. In many cases, the DevTools Console will flag an observed problem with a helpful error message. I don’t know of a great tutorial, but there are likely some on YouTube.
Chromium’s NetLogs (see chrome://net-export ) contain tons of detailed information about almost every aspect of networking, as well as other useful diagnostic data (the user’s enabled extensions, field trial experimental settings, etc). You can analyze NetLogs using a variety of free tools.
Chromium Tracing (see chrome://tracing ) allows you to diagnose performance issues in Chromium-based browsers using extremely in-depth tracelog data. Analysis of these logs isn’t for the faint-of-heart.
Chromium Logging (using the --enable-logging command line argument) is useful in diagnosing a number of internal issues in Chromium subsystems. Collecting and analyzing these logs is non-trivial, but is sometimes the fastest way to root-cause tricky problems. See the following resources:
- https://www.chromium.org/for-testers/enable-logging
- https://support.google.com/chrome/a/answer/6271282?hl=en
- https://cs.chromium.org/chromium/src/base/logging.h (Read the comments)
Chromium includes over 20 Internals Pages that allow you to view detailed information about media playback, data sync, and other features. Visit chrome://chrome-urls and search for -internals to see the list.
Browser Extensions
The VisBug Chrome Extension – Easily manipulate any page layout, directly in your browser.
postMessage Debugger – This extension prints messages sent with postMessage to the console.
Extension source viewer – View the source of browser extensions directly from the Web Store listing.
Cross-Platform Tools
WireShark allows packet-level analysis of network traffic. This can be useful in rare cases where a network bug depends on the exact packet size and timing.
The Fiddler Web Debugger allows import of NetLog and HAR traffic captures, and enables losslessly capturing requests and responses from any browser. While Fiddler Classic is (effectively) Windows-only, Fiddler Everywhere runs on Windows, Mac, and Linux.
Windows Tools
If you need to watch file or registry key creation/read/write/deletion, or thread/process creations and exits, then Sysinternals Process Monitor has got your back. For instance, this helped us easily root cause a bug where launching a Chromium-based browser would delete a file owned by Chrome.
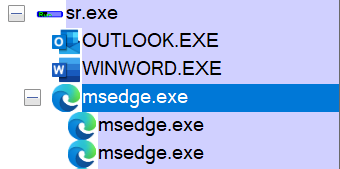
If you want to explore information about process sandboxing, startup parameters, Job limits, etc, then Sysinternals Process Explorer is the tool to use. For instance, this helped us track down a problem where a browser window was unexpectedly appearing. The user simply closed all browser instances, then waited for an unexpected browser to appear. Then, they looked at the process tree to see what application started it. For instance, in this case, Edge was launched by sr.exe:

If you need to debug a scenario involving drag/drop or copy/paste, you can use ClipSpy (binary only) or NirSoft InsideClipboard.
Bisecting
Bisecting is the process of making a repeated set of observations to determine the build in which a problem appeared (or disappeared). From there, you can easily assign bugs to the right owners for rapid fixes.
See the Bisect Regressions section of this post for details on how to use Chromium’s bisect-builds.py script (which does not require you to build Chromium or download all of its tools and source code) to bisect problems. Here’s another bisection case-study.
I’m sure there are a hundred great tools I’ve omitted. This post will grow over time. If you’ve got a suggestion for a great diagnostic tool, share with us!
-Eric
如有侵权请联系:admin#unsafe.sh