
2020-10-11 11:21:45 Author: medium.com(查看原文) 阅读量:326 收藏
![]()
Welcome to my series on memory analysis with Volatility. To start off the series I want to make sure we’re all sorted out with our knowledge of Windows internals. If you’re not sure you know about any of these subjects, you should go ahead and read about them a little.
You need to know the basics of how memory works in Windows. Ill try to explain as much as I can in the article. Other than that, whatever you don’t understand you’re welcome to read up on!
Reading list:
- Kernel Mode
- User Mode
- Virtual Memory
- Windows Processes
A little bit of background:
Memory forensics (sometimes referred to as memory analysis) refers to the analysis of volatile data in a computer’s memory dump. Information security professionals conduct memory forensics to investigate and identify attacks or malicious behaviors that do not leave easily detectable tracks on hard drive data.
Through the practice of memory forensics, experts are supplied with runtime system activity, such as open network connections or recently executed commands & processes.
Before programs are executed on the computer, they are loaded into the memory making the use of memory forensics of high importance. Each program or data which is created, examined, or deleted is stored in the RAM. This includes images, all web-browsing activity, encryption keys, network connections, or injected code fragments. In many instances, certain artifacts can only be found in the RAM, such as open network connections present during the time of the crash. Attackers can develop malware which only resides in the memory, rather than the disk, making it virtually invisible to standard computer forensic methods. This makes the need of memory forensics tools in high demand.
Volatility is an advanced memory forensics framework. It gives the investigator many automatic tools for revealing malicious activity on a host using advanced memory analysis techniques. It is implemented in python and is open source! I recommend checking out their git repository.
Volatility’s git repo and documentation:
Volatility’s malware-specific commands documentation
In this series I want to walk through a forensic search of the Coreflood trojan.
Coreflood is a trojan horse and botnet created by a group of Russian hackers and released in 2010. The FBI included on its list of infected systems “approximately 17 state or local government agencies, including one police department; three airports; two defense contractors; five banks or financial institutions; approximately 30 colleges or universities; approximately 20 hospital or health care companies; and hundreds of businesses.”[1] It is present on more than 2.3 million computers worldwide and as of May 2011 remains a threat. — Wikipedia
Download here (the .vmem file):
https://github.com/mgoffin/malwarecookbook/blob/master/16/6/coreflood.vmem.zip
The goal of this series is to understand what this malware is doing by using volatility and trying to explain my findings and my methods for memory forensics. I’ll try to uncover all the forensic artifacts I can about Coreflood in order to understand what the motive behind this malware is exactly. I hope to learn some new things from this forensic analysis and teach you some new things!
To start the investigation I want to begin with a simple listing of processes running on the host machine just to see if there is any obvious suspicious process running using the pslist command.
Windows uses a circular double linked list of _EPROCESS structures to keep track of all the active processes. This list lies in the Kernel. Volatility uses this fact and looks for the PsActiveProcessHead pointer which points to the start of the kernel’s list of _EPROCESS structures. Volatility walks along this lists to enumerate the processes running.
As we can see it seems like everything is normal but a few things catch the eye. Internet explorer is running and so is cmd, it seems like a proper thing to do is to check outbound connections, maybe the malware is disguised as Internet Explorer and uses the fact that Internet Explorer communicates regularly to hide its own communication to a C&C?
It might be a good idea to check out what cmd is up to over there but we’ll get to that later.
An intuitive action to take is to see the outbound connections. If we see that there are no outbound connections going through IE that look suspicious we might need to look elsewhere for out malicious activity.
I used the connscan command to check out previously terminated and currently active connections.
“To find _TCPT_OBJECT structures using pool tag scanning, use the connscan command. This can find artifacts from previous connections that have since been terminated, in addition to the active ones.” — Volatility documentation
The way this works is by scanning the physical memory for the four-byte signature 0x54455054 (“TCPT”) and parsing out the next 28 bytes as the full _TCPT_OBJECT .
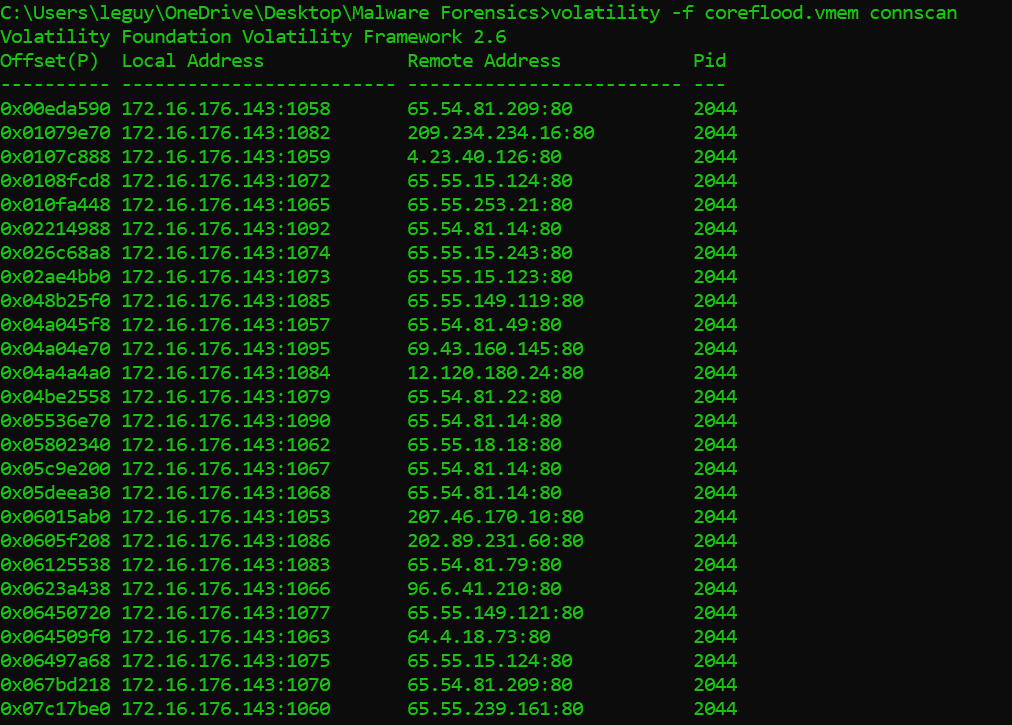
It seems like the host was communicating legitimately, all the communication is created by pid 2044 which is IEXPLORE.EXE. I checked out the geolocation of these IPs. They were all registered under some large companies such as Microsoft, AT&T and such… It could be that the data about the IPs has changed be since this is an old vmem file under investigation. It also could be some fake data about these IP addresses registered by the hackers to trick the investigators.
Just to make sure there is no malicious communication at all, we should check the inbound connections to be on the safe side. I will use the sockscan command, the sockscan command scans the memory for _ADDRESS_OBJECT . By scanning the memory for this memory structure we could get insight into previously opened and currently open sockets.
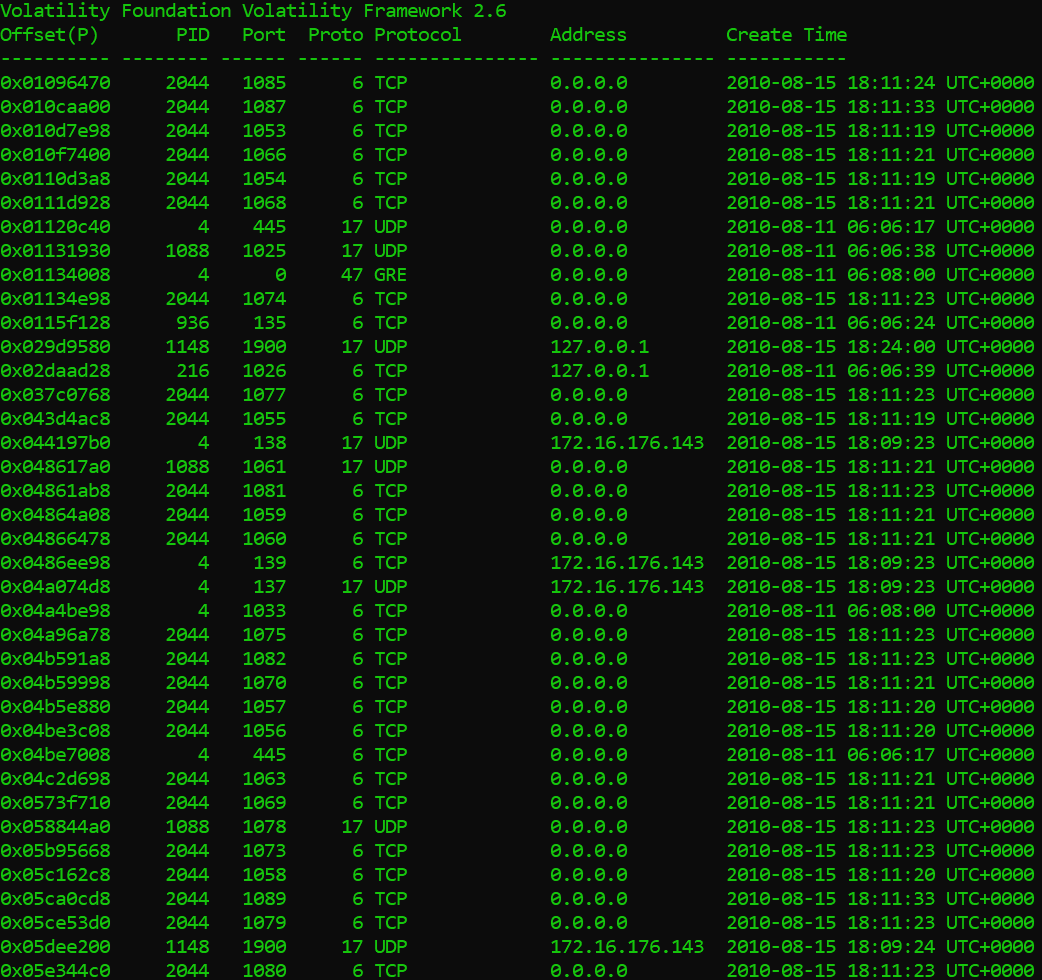
As we can see there are some pretty weird inbound connections coming into pid 2044, or as we call it: IEXPLORE.EXE. This look suspicious and I think its time we take out our big guns, I suspect there may be a malware hiding in that process.
Its time to pull out Volatility’s big guns and use the powerful malware analysis tools it offers.
The first command well use is the malfind command. This command is used to find injected code inside the processes memory. It does this by looking for sections of allocated memory ( by looking at the VAD tree data structure) and checking if they have hints of executable code that are not mapped to any file on the disk.
“VAD nodes also reference a number of other kernel structures that may be useful to an investigator… From there, if the region is used for a mapped file (such as a loaded DLL), the corresponding _FILE_OBJECT structure can be referenced and the name of the file can be extracted. This can provide an investigator with an alternate method of listing modules loaded by a process, which can then be compared with other methods (e.g., those described by Walters, 2006) to find evidence of library injection and hidden modules.” — Science Direct
The method used to check if a section of memory contains injected code is by checking the VAD for page permissions, such as execute. If a section in the memory has execute permissions and it is not mapped to any executable file on the disk, this is a clear warning for what might be a code injection.
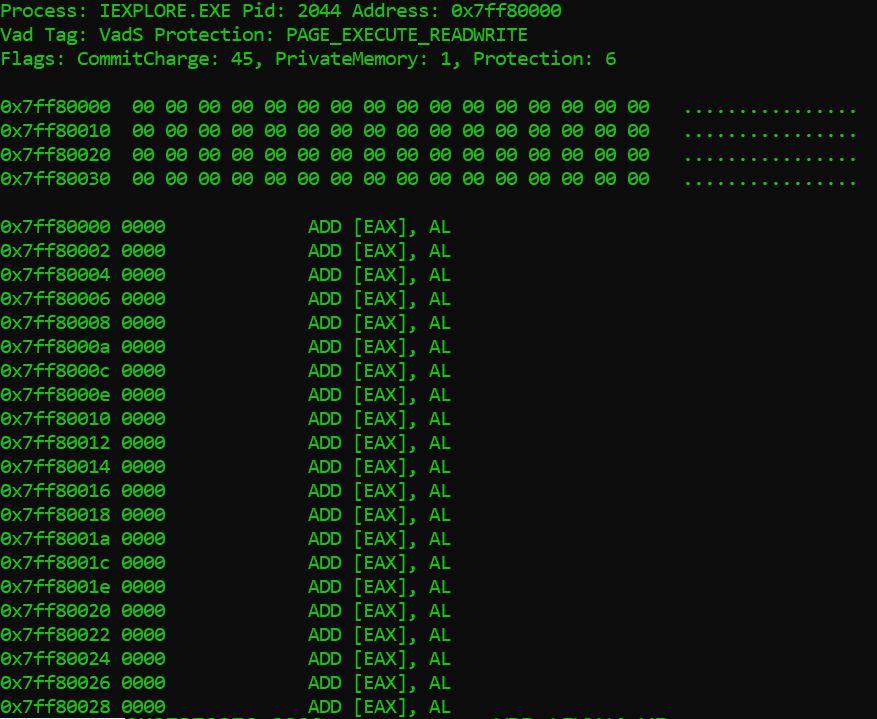
As we can see in the image above, looks like the command output doesn’t really tell us much. It seems as though the output of malfind is pretty benign.
It may be that the malware did not load any explicit PE (portable executable) into memory and just injected some shellcode or that the image header is paged. It could also be that the malware cleared out the PE’s header from memory to avoid detection by calling VirtualFree on the injected DLL’s ImageBase. It could also be that this section of memory is paged or unreachable for some reason. Anyways, we can’t know for sure since there is no concrete evidence of malicious activity here.
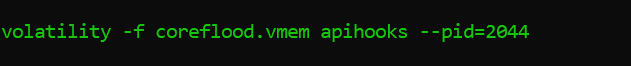
The next command we can use is apihooks:
“ This finds IAT, EAT, Inline style hooks, and several special types of hooks. For Inline hooks, it detects CALLs and JMPs to direct and indirect locations… and calls to unknown code pages in kernel memory.” — Volatility Documentation
In order to understand what exactly is going on here we need a quick recap of IAT and EAT.
When an executable is first loaded, the Windows loader is responsible for reading in the files PE structure and loading the executable image into memory. One of the other steps it takes is to load all of the dlls that the application uses and map them into the process address space.
The executable also lists all of the functions it will require from each dll. Because the function addresses are not static a mechanism had to be developed that allowed for the these variables to be changed without needing to alter all of the compiled code at runtime.
This was accomplished through the use of an import address table (IAT). This is a table of function pointers filled in by the windows loader as the dlls are loaded.
The EAT works in the same way as the IAT, apart from the library will be exporting the functions to the image executable, in which the program will import into the IAT (I won’t get into the nitty gritty details).
These two memory structures can be manipulated by malware in order to make the executable call some other function rather than the function intended to be called.
I want to use apihooks specifically on IEXPLORE.EXE just because I am already suspecting it might have been tampered with based on the output of sockscan.
Suprise! Internet Explorer has been hooked a dozen times to call the same function.
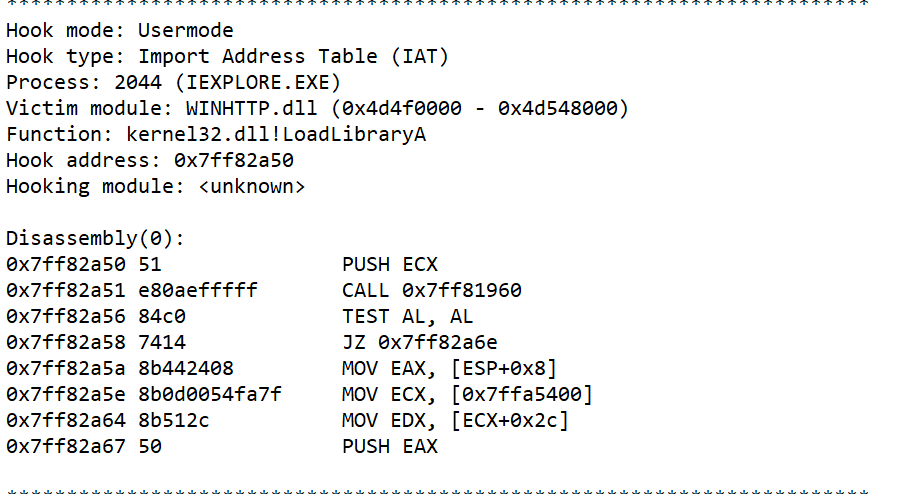
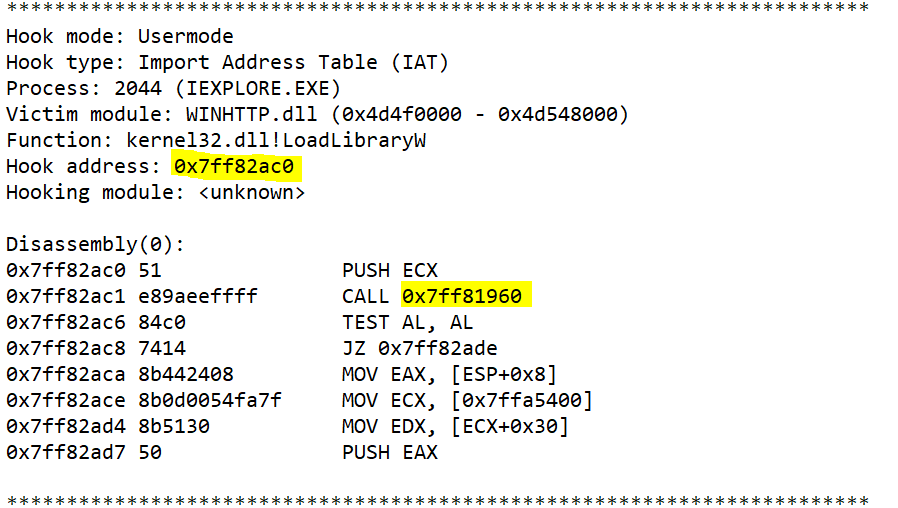
We can see above, the output of the command apihooks that we saved in a text file. This is one out of the other dozen of hooks to different functions. They all call the same address 0x7ff82a6e
We can see that the malware hooked LoadLibrary in WINHTTP.dll in this example.
LoadLibrary can be used to load a library module into the address space of the process and return a handle that can be used in GetProcAddress to get the address of a DLL function. LoadLibrary is a very obvious choice for hooking since we know many PE’s use other dlls and therefore import their functionality.
We need to find out what the malware is trying to achieve here. In order to do that we need to try dive into the piece of code the malware is trying to execute. Therefore, we are going to use Volatility’s volshell. Volshell is a powerful tool we can use to browse our memory. We can jump to sections of memory, see whatever is in them and then dissasemble or read whatever is inside.
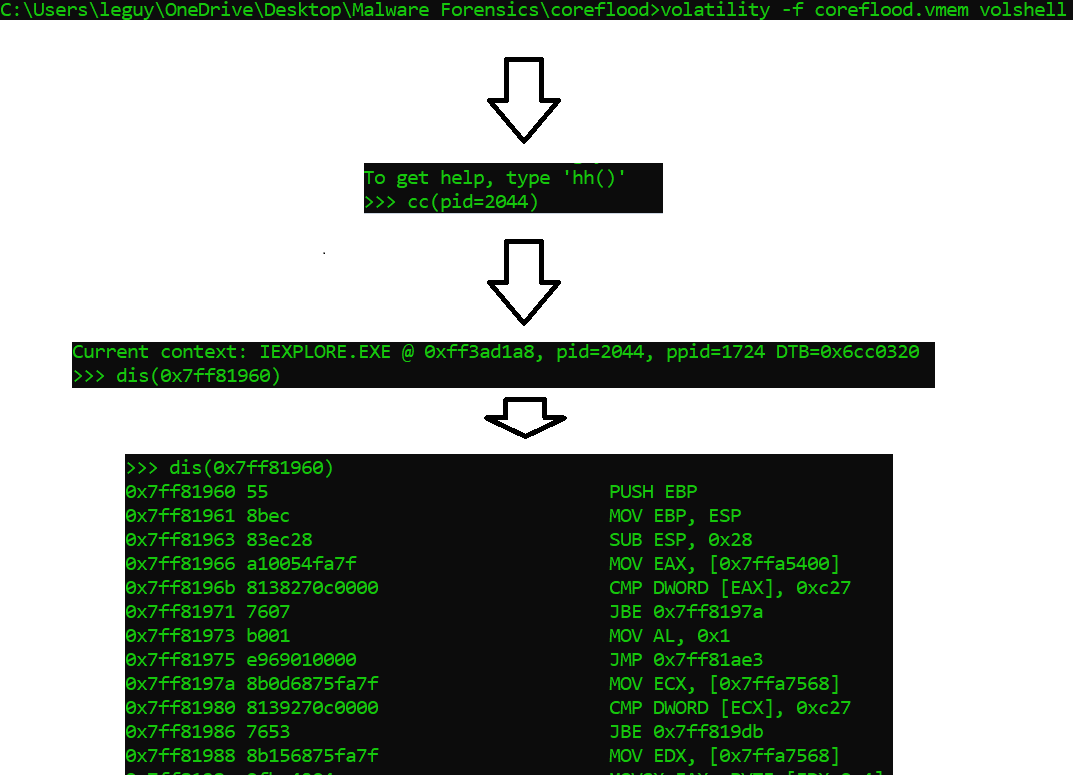
After typing the volshell command, I used the cc(<context) command to change into the memory context of certain process. I used the pid of iexplore.exe (pid=2044) as an argument to the command in order to dive into the context.
As we can see above, the relevant address we want to disassemble in order to find out what are malware is doing. I copied this address as an argument into the volshell command dis(<copied_addres>) as noted above in our flow chart.
Our final output should be the malicious injected code:
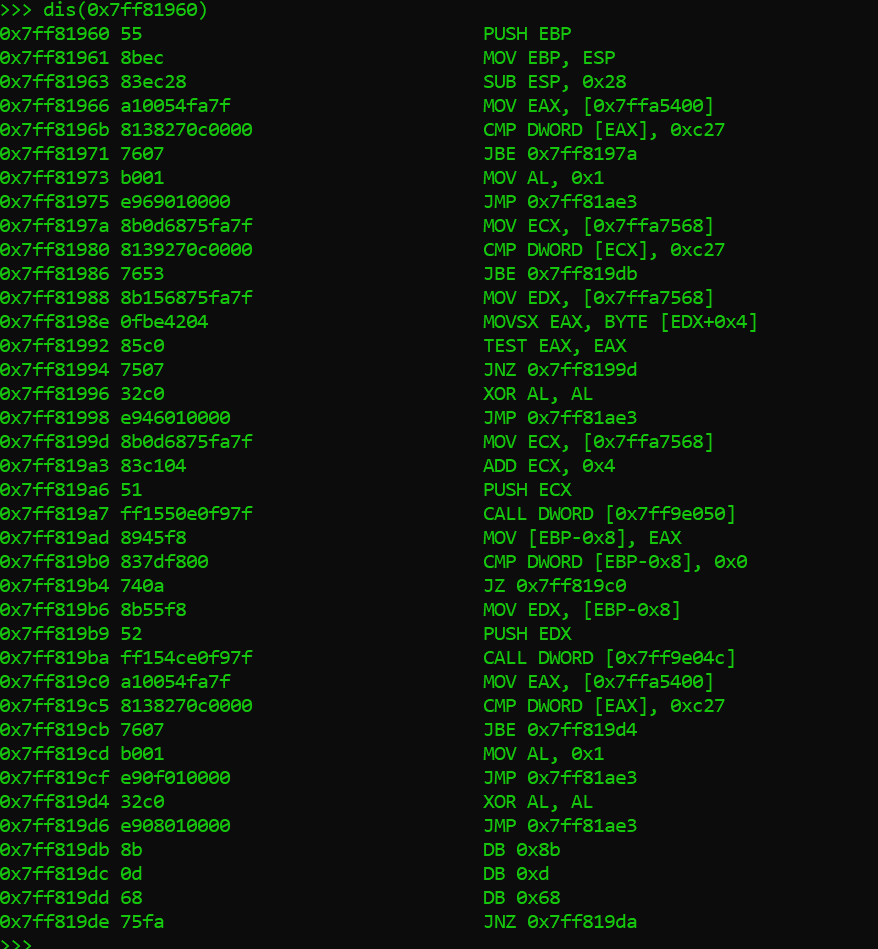
You will have to wait for the part of the series to try and find out what this malicious piece of code is doing. Maybe you can try for yourself in the meanwhile.
To sum things up for this part. We used volatility to find suspicious or malicious code running on our host’s machine. We started with some basic actions such as making sure there isn’t anything suspicious that we can spot immediately such as a suspicious process or some traffic to an unusual IP address. We ended up pulling out our big guns to try and see if our malware is hiding by injecting code into innocent processes and we discovered some interesting things. In the next part I’ll dive deeper into the code and try to see what this malware is trying to achieve exactly.
Hope you had a good read, see you in the next one.
如有侵权请联系:admin#unsafe.sh