Those who have read previous posts may have seen my NUC cluster series that I put toget 2026-6-7 01:8:13 Author: blog.zsec.uk(查看原文) 阅读量:36 收藏
Those who have read previous posts may have seen my NUC cluster series that I put together a few years ago. Well I've rebuilt my homelab and network cluster from the ground up and upgraded lots of things to support ongoing development of my LMS and course through ZephrSec. Along with some research to follow up with my MCP blog post I wrote earlier.
So, what’s changed since the last build?
Well I still have the 4 NUCs, 3 of which are currently active but I have a phased plan to replace them all with 2 new hosts, I currently have a new Proxmox host which lives on a MS-02 Ultra with lots of RAM and the goal is to replace 2 NUCs per MS-02 with headroom to grow.
The other new stuff includes:
- New networking kit
- 10Gig backbone with various connections
- More space on my NAS
- Double UPS capacity
- Now have 2x APC UPCs and I had claude make a pretty dashboard(https://github.com/ZephrFish/APC-Dash) to monitor them via their USB to Serial Port:

I also got claude to write a routine to essentially monitor the UPSes and send notifications if power lossage happens it'll send SNMP signals to things across the network to safely shutdown.
Why the Rebuild?
The goal wasn't simply to buy new hardware or make the rack look nicer(although it was a partial driving factor to have new shiny kit). Over the last few years my homelab has evolved from a place to tinker with virtual machines into a platform that supports a significant portion of my day-to-day work.
Today it serves multiple purposes simultaneously:
- Development and testing for the ZephrSec LMS
- Course content validation and lab development
- Vulnerability research and bug hunting
- Infrastructure testing
- Home services and storage
- General experimentation with new technologies
As those workloads increased, the limitations of the older environment became more apparent. Storage was beginning to feel constrained, networking was becoming a bottleneck, and I found myself spending more time managing the platform than actually using it.
Perhaps the biggest improvement, however, is operational visibility. Between Homepage, Homarr, Proxmox, Portainer and the Ubiquiti ecosystem, I can now see almost every component of the environment from a handful of dashboards. Whether I'm troubleshooting a service, checking VM utilisation, reviewing wireless performance or validating course infrastructure, everything is only a few clicks away.
New Proxmox Host
Having moved across to Proxmox a few years ago from ESXi, I find it really easy to manage and create VMs both from the CLI qm interface and the browser based GUI. The new host has a decent spec list which cost a few grand due to the rise in hardware costs but as it now serves as my primary research system with multiple docker images and VMs it's worth it.
The new MS-02 has the following specs:
- Minisforum MS-02-Ultra Core Ultra 9 285HX (24c/24t)
- 256 GB (4x64GB) DDR5
- 8TB SSD Storage (2x4 TB) Crucial T710 Gen5 NVMe - I didn't need Gen5 as the board supports Gen4 but for some unknown reason at the time of purchase Gen5 was cheaper than Gen4
- 25Gig networking cards + 10Gig onboard so plenty to keep the data flowing
- PCIe Screamer for hardware Direct Memory Access (DMA) research
One slightly unusual addition is a PCIe Screamer card which I use for hardware DMA research. It's not something I use daily, but having dedicated hardware available makes it significantly easier to experiment with memory acquisition techniques, device interactions and other low-level research topics without having to constantly rebuild test environments and also blend into an environment that has no idea the card exists.
Proxmox Stack
Much like the previous series, the setup is using Proxmox but this time it's not a cluster and instead is a singular host with lots of RAM and SSD storage space thus serving as a nice baseline for VM and Docker consumption.


Currently there are several stacks deployed onto the host;
The first is the range for my course which is used for debugging and running through examples for the course:
- lms.zsec.red lab range for testing

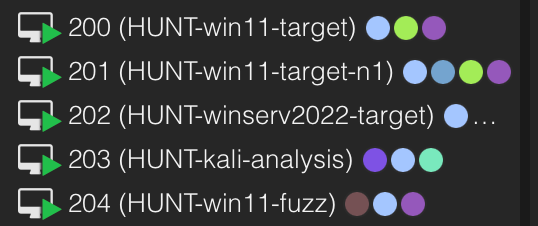
The second range is my active bug hunting pipeline which runs several windows machines and linux for AI bug hunting as discussed in depth within a previous post:
| VM | Platform | Role |
|---|---|---|
| hunt-win11 | Windows 11 (latest patch) | Primary target |
| hunt-win11-n1 | Windows 11 (N-1 patch) | Binary diffing against previous Patch Tuesday |
| hunt-winserv | Server 2022 | RPC, services, AD attack surface |
| hunt-kali | Kali Linux | Ghidra, radare2, GDB/pwndbg, angr, Volatility3 |
| hunt-fuzz | Windows 11 | Dedicated fuzzing (WinAFL, Jackalope, DynamoRIO) |
- HUNT VM range for research

Then on top of the two VM ranges there are also a whole host of docker images, Portainer is used to manage them and I have everything from observability to internal single sign on and everything in-between, the dashboard below shows a snippet of some of the images I have deployed.
Much like my previous homelab posts using Homarr, I opted to move across to use both Homarr(https://homarr.dev) and Homepage(https://gethomepage.dev). One thing I quickly learned after rebuilding the lab was that I had reached the point where remembering every service URL was becoming a challenge. Between the LMS infrastructure, bug hunting systems, observability stack, identity providers, Portainer, development environments and research tooling, there were simply too many moving parts.
To solve that problem I deployed Homepage, an open-source dashboard that provides a central landing page for services, containers, VMs, bookmarks, metrics and operational status. Rather than maintaining a collection of browser bookmarks, Homepage gives me a single pane of glass for everything running within the environment.
Deploying Homepage
Deployment is straightforward using Docker Compose.
services:
  homepage:
    image: ghcr.io/gethomepage/homepage:latest
    container_name: homepage
    restart: unless-stopped

    ports:
      - "3000:3000"

    volumes:
      - ./config:/app/config
      - /var/run/docker.sock:/var/run/docker.sock:ro

    environment:
      HOMEPAGE_ALLOWED_HOSTS: dashboard.zsec.red
Once started, Homepage becomes available on port 3000 and can be placed behind a reverse proxy such as Nginx Proxy Manager, Traefik or Caddy which I did to essentially expose it on port 80 on my home lab system using the following config on Nginx:
server {
    listen 80;
    server_name homepage.zsec.local;

    location / {
        proxy_pass http://127.0.0.1:3000;

        proxy_set_header Host $host;
        proxy_set_header X-Real-IP $remote_addr;
        proxy_set_header X-Forwarded-For $proxy_add_x_forwarded_for;
        proxy_set_header X-Forwarded-Proto $scheme;

        proxy_http_version 1.1;
        proxy_set_header Upgrade $http_upgrade;
        proxy_set_header Connection "upgrade";
    }
}
The Docker socket mount allows Homepage to pull information directly from running containers, including status, health checks and resource usage.
Building the Dashboard
Homepage is configured using a handful of YAML files located within the config directory.
The most important are:
services.yamlwidgets.yamlbookmarks.yamldocker.yamlsettings.yaml
My deployment is organised into logical sections covering infrastructure, research, development and monitoring.
- Infrastructure:
    - Proxmox:
        href: https://proxmox.zsec.red
        icon: proxmox.png

    - Portainer:
        href: https://portainer.zsec.red
        icon: portainer.png

    - NAS:
        href: https://nas.zsec.red
        icon: synology.png
This creates a clean dashboard that provides quick access to commonly used services.
Ingesting Docker Container Information
One of Homepage’s most useful features is its ability to automatically gather information from Docker.
The Docker integration is configured through:
my-docker:
  host: unix:///var/run/docker.sock
Once configured, services can display real-time container information directly on the dashboard.
- Portainer:
    href: https://portainer.zsec.red
    icon: portainer.png
    container: portainer
Homepage will automatically display whether the container is running, stopped or unhealthy.
This removes much of the context switching that normally occurs when managing a large number of services.
Integrating Proxmox
Homepage also supports Proxmox API integration.
After creating an API token within Proxmox, widgets can be configured to display:
- Host CPU utilisation
- Memory consumption
- Storage utilisation
- VM counts
- Node status
I started to play around and configure more, here's an example of connecting to one of my PVE nodes as at the time of writing I still have my NUCs but this will change soon when I replace them with a second MS-02 ultra.
- proxmox:
    url: https://proxmox.zsec.red:8006
    username: homepage@pve
    token: homepage!dashboard
    secret: YOUR_SECRET
This provides a quick health overview without opening the Proxmox interface itself.
Pulling Metrics from the Lab
The dashboard also consumes information from various supporting services:
- Grafana
- Prometheus
- Uptime Kuma
- Authentik
- Portainer
- Docker
- Proxmox
- NAS monitoring
As the environment continues to grow, Homepage effectively acts as the operational front door to the entire homelab.
Instead of jumping between browser tabs or maintaining dozens of bookmarks, I can immediately see:
- What is running
- What is unhealthy
- Which systems need attention
- Resource utilisation across the environment
- Quick links into management interfaces
For a lab that now hosts development environments, training infrastructure, bug hunting systems and research platforms, having that visibility in a single location has become one of the most useful additions to the rebuild.
New Network
In addition to updating my VM stack I also rolled out a new home network with a 10Gig backbone and new access points and other fun things. Much the same as previously I went full Ubiquiti as their kit works nicely with everything and ties together into a single pane of glass dashboard with easy to integrate functions.
Bought their mini rack too to house everything in my old integrated wardrobe which doubles up as my network and computing stack with UPSes and various powerful networking kit!

My new network consists of the following:
- Dream Machine Pro Max(DPM) - ISP inbound to it via Ethernet
- USQ Pro XG 24 PoE - 10Gig port connecting to broader network and SFP+ connection to the DPM
- 2x E7 Access Points (I found out once they arrived not only are they massive, they're meant for stadiums and I don't live in a stadium)
I also upgraded my doorbell and chime to use the G4 Doorbell Pro and Chime all powered via PoE which works nicely. I also maintain separate VLANs for lab infrastructure, work systems, media services and general household devices. Segmentation has become increasingly important as the environment has grown, and Ubiquiti makes managing those networks relatively painless.

There's a decent amount of stuff connected to my network, light blue indicates 10Gig, Green for 1Gbit and given most stuff supports either I also have my NAS with a bonded 1Gig + 10Gig connection for maximum throughput.

What's Next?
The rebuild isn’t finished yet and there are still plenty of things I want todo along the lines of IoT kit upgrades, other things to add to home network.
The immediate plan is to replace the remaining NUCs with a second MS-02 Ultra, further consolidating workloads and continuing to expand both the LMS and research environments. There are still a handful of services running on legacy systems that need migrated before I can finally retire the older hardware, but the majority of the heavy lifting has now been completed.
Beyond that, I’m continuing to invest in the vulnerability research pipeline, AI-assisted bug hunting workflows and course infrastructure. The goal isn’t to build the biggest homelab possible or fill a rack with expensive hardware for the sake of it. Instead, I want a platform that enables the projects I care about and gets out of the way when I need it to.
Compared to the previous generation of the lab, the new environment provides significantly more compute, storage, networking capacity and operational visibility, whilst occupying less space and requiring less day-to-day management. Between Proxmox, Homepage, Homarr, Portainer and the Ubiquiti ecosystem, I can spend less time administering infrastructure and more time using it.
Most importantly, it lets me focus on the things I actually built it for: research, development, teaching and occasionally breaking things.
Knowing me, there will probably be another rebuild post in a few years’ time.
如有侵权请联系:admin#unsafe.sh