At some point, developers on your team stopped acting on security findings. Not because they stopped caring about security, but because they learned that most findings are not real. A scanner flooded the queue with so much noise that ignoring it became the rational response.
The question is how did that happen, and how can you evaluate if your next tool will do the same thing?
It comes down to how vendors measure accuracy.
A scanner can lower its false positive count by simply flagging fewer things, but this means real vulnerabilities are passing through undetected. A scanner can also raise its detection rate by flagging everything, but this means your developers spend their time chasing noise until they stop looking at findings altogether. Both outcomes look fine on the summary slide – but neither is fine in practice.
The metric that closes this loophole is the F1 score, a specific type of F-score that weighs precision and recall equally. Improving it requires improving both simultaneously – gains in one don’t compensate for weakness in the other.
It’s also why most AppSec vendors don’t advertise their F1 score: the numbers reveal what they’d rather hide. Publish a weak F1 and they’re admitting either that the scanner either misses critical vulnerabilities or that it drowns users in false positives. And neither is a compelling sales pitch.
The Basics: Precision and Recall
Every security scanner produces four types of outputs:
- True positives (TP): real weaknesses the scanner correctly identified.
- False positives (FP): findings that are not actually weaknesses.
- False negatives (FN): real weaknesses the scanner missed.
- True negatives (TN): clean code that the scanner correctly ignored.
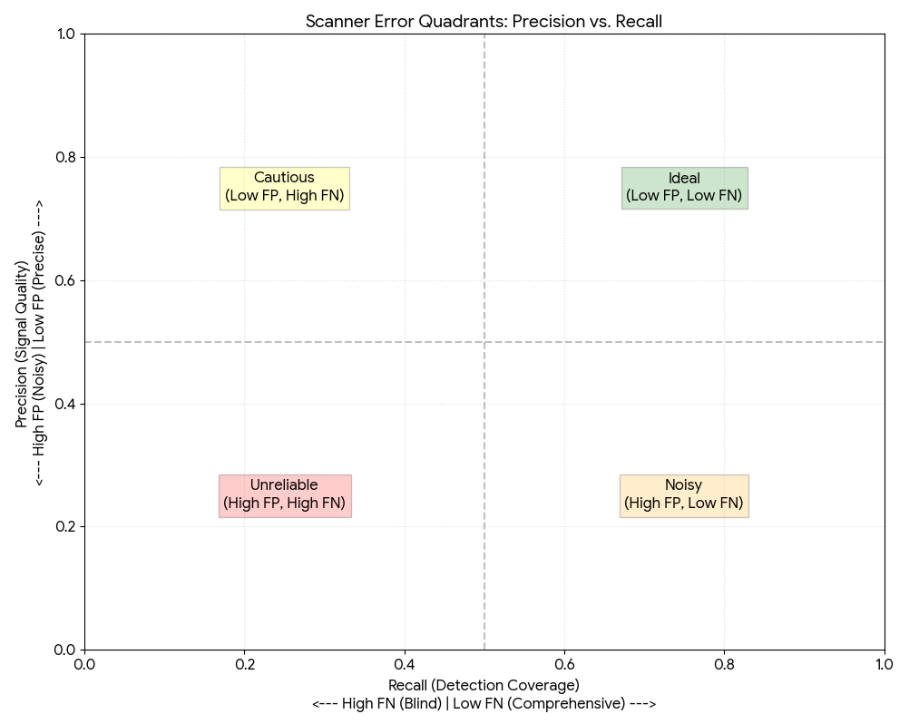
Precision measures the share of findings that are real: 𝑇𝑃 / (𝑇𝑃 + 𝐹𝑃).
A high-precision scanner means fewer false positives so your team spends less time investigating findings that turn out to be nothing. The catch is that a scanner can achieve perfect precision by flagging almost nothing, which means real vulnerabilities sail through undetected.
Recall measures the share of real vulnerabilities that were found: 𝑇𝑃 / (𝑇𝑃 + 𝐹𝑁).
A high-recall scanner misses very little. But its catch is that a scanner can achieve perfect recall by flagging everything, which destroys signal-to-noise ratio (and sends your developers back to ignoring the queue).
AppSec vendors exploit this tension constantly. A tool can reduce false positives by simply reporting fewer findings, which quietly creates false negatives, letting real vulnerabilities pass through undetected. The tool looks precise on paper, but the vulnerabilities it stopped flagging didn’t disappear – they just stopped showing up in the report.
What the F Score Captures
The F score is the harmonic mean of precision and recall, a single number that captures both at once:
Unlike a simple average, the harmonic mean heavily penalizes imbalance. A scanner with 90% precision but only 10% recall scores of 0.18, not 0.5. Both numbers must be high at the same time to produce a strong F1 score. You cannot hide a weak recall behind a strong precision score, which is exactly what makes it a more honest benchmark than either metric alone.
An F1 score runs from 0 to 1. What counts as a good score depends on the data being analyzed. Controlled benchmark studies with purpose-built vulnerable code tend to produce higher scores across all tool categories than tests on real production code. On real production code, scores are lower across the board – for traditional SAST tools, LLM-native reviewers, and hybrid approaches alike. This isn’t a flaw in the tools, but a reflection of how messy the real world is compared to carefully constructed examples.
This is why the test dataset matters as much as the score itself. A vendor quoting an F1 score based on a controlled benchmark is making a very different claim than one quoting a score from real production code. And, if a vendor does not name the dataset, that is worth asking about.
Why This Matters for SAST
Static application security testing (SAST) is a classification problem at scale. On a single codebase, a scanner might analyze thousands of code paths and return hundreds of findings. For AppSec teams managing backlogs, false positives from scanners teach developers to ignore scanner output, leading to worse security outcomes.
Traditional rules-based SAST engines tend to favor high recall: find every possible match for known patterns. The tradeoff is well understood: by casting a wider net, they inevitably produce a higher false positive rate. Most security teams have learned to accept this as the cost of minimizing missed vulnerabilities.
AI-driven scanners take a different approach. Because they aren’t limited to simple pattern-matching, they can reason about the code in ways AI-only SAST engines cannot. But they introduce a different challenge: an AI model reviewing the code can’t self-police. It’s the computational equivalent of the fox guarding the hen house.
Some vendors address the false positive problem by reducing recall, so the findings look cleaner, which in turn quietly increases false negatives. Vulnerabilities that are missed do not announce themselves – and as a result, vendors can advertise low false positive rates while quietly allowing more real issues to slip through. This is precisely why the F1 score matters. It makes the “low FP” trick harder to get away with. Vendors that report recall without precision (or precision without recall) are just emphasizing whichever metric presents their product more favorably. The F1 score puts both dimensions on the table simultaneously, providing a more balanced measure of scanner effectiveness.
What Good Looks Like in Practice
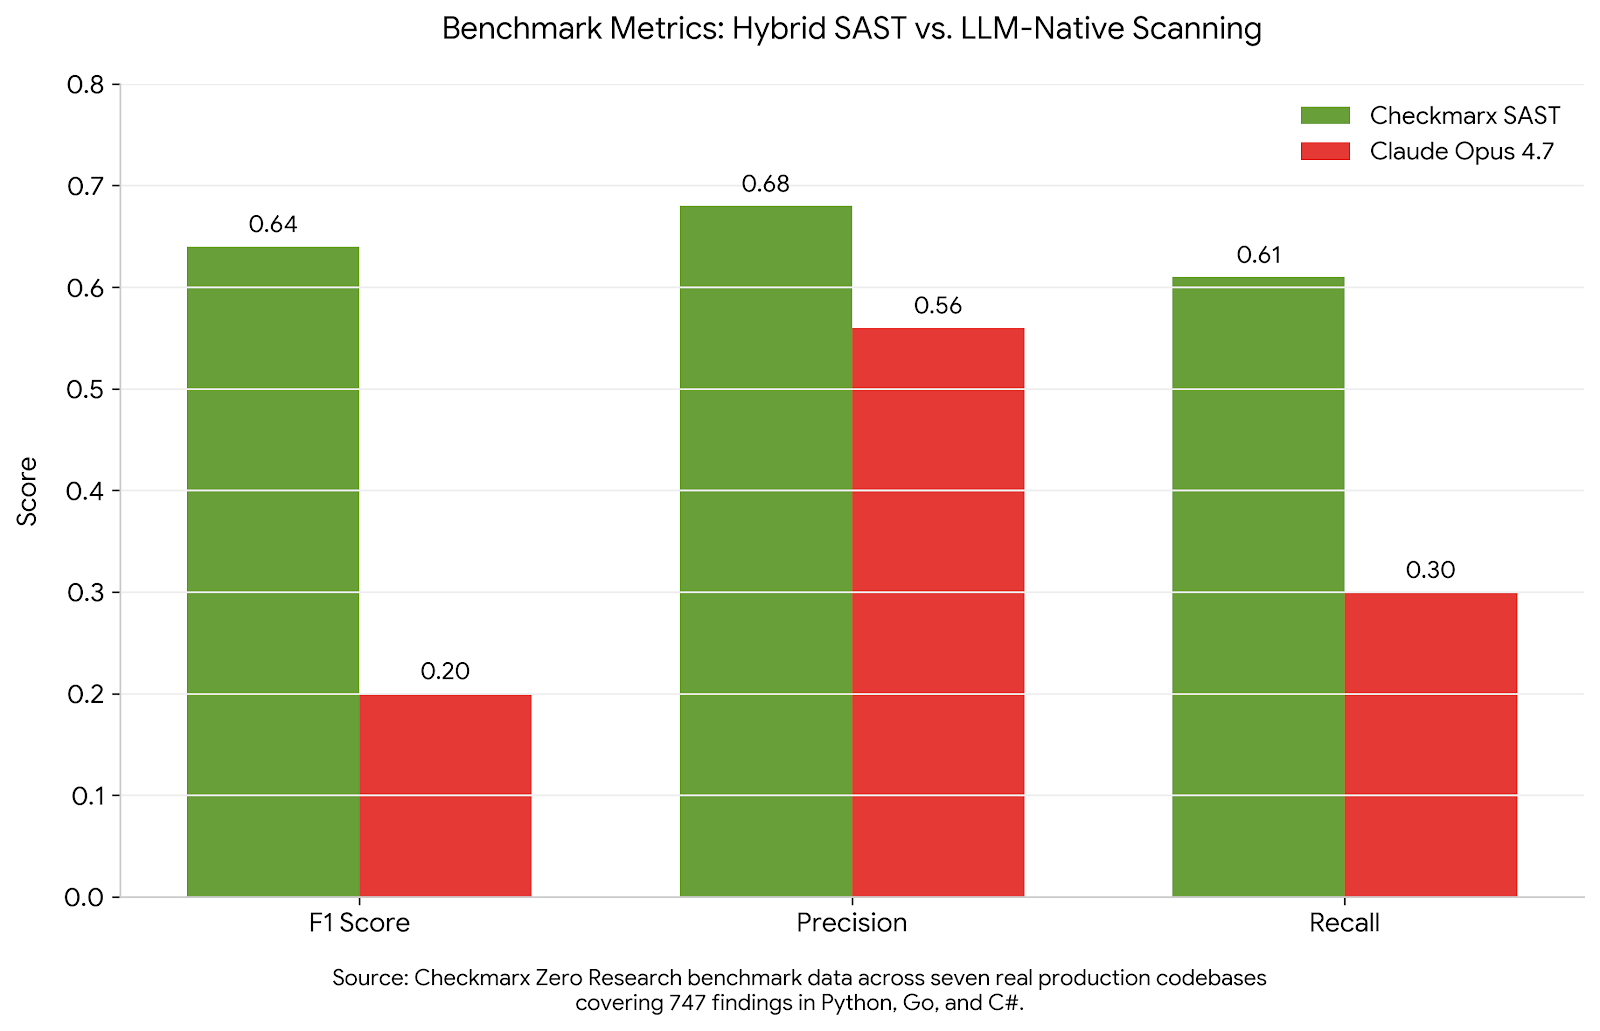
Checkmarx Zero research published benchmark data from a study across seven production codebases (Istio, indico, OpenMRS, Mezzanine, SimplCommerce, Jellyfinn, ThreatByte) comparing hybrid SAST against LLM-native scanning with Claude Opus 4.7. The results:
- Checkmarx SAST: F1 score of 0.64
- Claude Opus 4.7 (standalone LLM reviewer): F1 score of approximately 0.20
The gap is significant. Checkmarx Zero research tested an LLM-augmented SAST engine head-to-head against Claude Opus 4.7 across seven real production codebases in Python, Go, and C#, covering 747 findings. The Checkmarx engine had an 11% higher true positive rate than Opus 4.7, found 327 additional true positives that Opus missed entirely, and Opus 4.7 generated a 44.1% false positive rate. Nearly half its findings were wrong.
The gap comes from architecture, not just model quality. The hybrid approach runs a deterministic rules engine first, extends coverage with a purpose-built AI model, then applies a classification layer that filters findings before they reach the analyst. Each layer addresses what the others cannot do alone.
For the full methodology and benchmark detail: LLM Application Security: Governing AI-Driven Risk Across the Software Lifecycle.
How to Use F Score To Evaluate a Scanner
If the F1 score is the most balanced measure of scanner performance, then it should also be one of the first metrics you ask about when evaluating a vendor. Unlike standalone precision or recall figures, the F score makes it much harder to hide tradeoffs between finding vulnerabilities and avoiding false alarms.
Start by asking a vendor for their scanner’s F1 score on a defined, real-world codebase. The dataset matters. Purpose-built, vulnerable-by-design projects are useful for research and benchmarking, but do not represent production code. What matters is results from real code shipped by real software teams.
Ask if precision and recall are reported separately. A vendor willing to disclose both numbers is making a more credible claim than one that highlights only detection rates or false positive reduction. Without both numbers, it’s impossible to understand the actual performance.
Watch for vendors who improve one metric by degrading the other. Lower false positives achieved by missing more vulnerabilities is not an accuracy improvement. F1 exposes exactly that tradeoff.
If a vendor cannot provide an F1 score or refuses to identify the test dataset, that should prompt further investigation before making a purchasing decision.
The Bottom Line
Security vendors will always have metrics, benchmarks, and marketing claims. Detection rates, false positive reductions, and accuracy scores that can all look impressive in isolation. The problem is that each tells only part of the story – and many can only be improved by optimizing one outcome while sacrificing the other.
The F1 score is different. It rewards scanners that can do both: find real vulnerabilities and avoid overwhelming teams with false alarms. A scanner cannot achieve a strong F1 score by excelling at only one side of that equation.
That is why the F1 score is one of the most useful measures of scanner performance. It forces precision and recall to be evaluated together, making tradeoffs visible instead of hiding them behind carefully selected statistics.
When a vendor can provide an F1 score on a named, real-world dataset, they are making a claim that can be examined, challenged, and compared. When they avoid quoting one, it is worth asking why.
That is the starting point for any honest conversation about scanner accuracy.
See how our Checkmarx SAST helps reduce noise, uncover more real vulnerabilities, and deliver balanced performance across precision and recall.
Tags:
Agentic AI
Agentic AppSec
AI generated code
AppSec
SAST