
Continuing our journey through Sentinel ingestion cost reduction, this part focuses on one of 2026-7-7 09:0:41 Author: blog.nviso.eu(查看原文) 阅读量:27 收藏
Continuing our journey through Sentinel ingestion cost reduction, this part focuses on one of the most expensive log sources: firewalls, and more specifically, network traffic events.
Network traffic logs from firewalls are highly voluminous and often become the largest contributor to data ingestion costs. At the same time, they remain a valuable source of information during Incident Response or while developing Threat Detection use cases, as they provide a centralized view of network activity across the environment. This creates a familiar dilemma for many Security Teams: should firewall traffic logs be ingested into Sentinel?
The objective of this part is to examine how Summary Rules can help reduce the cost of ingesting firewall traffic events while maintaining the visibility needed to support Detection and Incident Response.
Detect Threats through Network Events
Detection Types
Firewall traffic events can enable multiple detection scenarios, particularly related to network-based attack behavior. Typical examples include reconnaissance activity such as port scanning and port sweeping, where a source system attempts to probe multiple ports or hosts in a short period of time.
They can also be used to identify communication with known malicious or suspicious destinations through correlation with Threat Intelligence feeds. This includes communication with known command-and-control infrastructure or anonymization services such as Tor. Depending on the environment, these patterns can support the detection of malware activity, lateral movement, or policy evasion.
Ingestion Cost
To illustrate the financial impact, consider a typical Microsoft Sentinel environment using the pay-as-you-go pricing model at $5.59 per GB (price for West Europe at the time of writing1). In an average environment, ingesting 50 GB of firewall traffic logs per day into the Analytics tier would cost approximately $8,500 per month. For a more accurate view of expected costs in your own environment, Microsoft provides the Sentinel Cost Estimator app2.
Over the next sections, we will present a practical solution to this challenge and provide a technical implementation that reduces cost without compromising the visibility these logs can offer.
Summary-Based Network Scan Detection
Understanding Network Scans
To demonstrate the approach presented in this article, we will focus on the detection of network scanning activity. Before diving into the implementation details, it is important to understand what a network scan is and how this behavior appears in firewall traffic logs.
A network scan is a reconnaissance technique used to discover live hosts and enumerate exposed services within a network. In practice, this usually involves sending connection attempts to multiple ports or hosts, or both, in order to identify reachable systems and determine which services are listening. This information can be used to map the environment and identify potential attack paths.
From a logging perspective, a network scan appears as a deviation from the normal traffic flow generated by an endpoint. Under typical conditions, a workstation browsing the internet will establish multiple outbound TCP connections, most commonly over ports 80 and 443. For a domain-joined system, it will also regularly communicate with internal infrastructure such as Domain Controllers over expected services like Kerberos, LDAP, DNS, or SMB.
What is less typical is an endpoint attempting connections to a larger number of ports in a very short period of time, especially when targeting the same destination. For example, if a workstation attempts to connect to ports 1 through 1024 on the same destination in under one minute, this would be a strong indicator of vertical scanning. Likewise, repeated connection attempts to the same port across many different hosts may indicate horizontal scanning.
Lab Infrastructure Setup
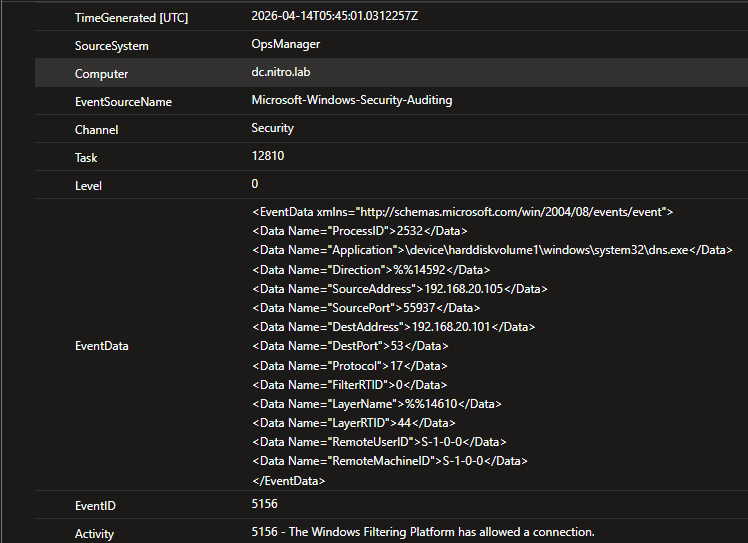
In the first part of this series, we explored split transformation rules and how they can be used to redirect part of the ingestion stream to the Data Lake. For this showcase, we keep the setup simple: a Windows server ingesting Windows Filtering Platform (Windows Firewall)3 events in Microsoft Sentinel into the Data Lake directly.
Although Windows Filtering Platform can generate logs for a broader range of activities, this demonstration focuses on two core connection events:

Network Scan Simulation
To simulate a network scan in the lab environment, we used Nmap6, a common tool for network discovery and port enumeration.
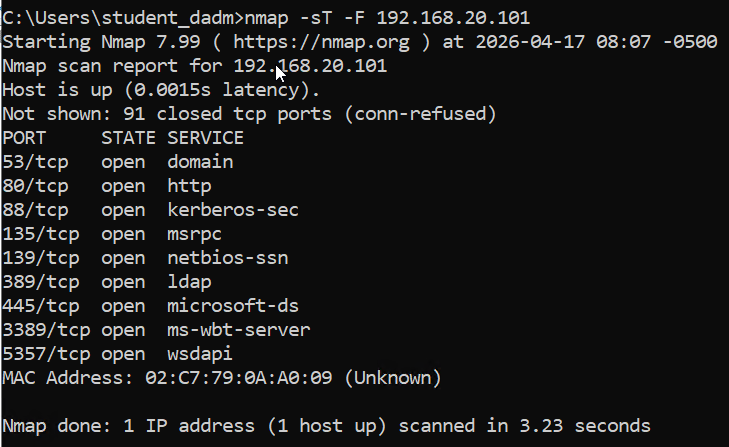
As expected, the scan identified open ports and their associated services on the target system.
More importantly, this activity generated a series of network traffic events that can now be examined to understand how a vertical scanning attempt is represented from a telemetry perspective.
Using the KQL code below, we parse the EventData XML field of the EIDs 5156 and 5157 to create the fields for the illustration. In particular, the parse operator 7is used to extract specific values from the XML structure, while the ASIM helper function _ASIM_LookupNetworkProtocol8 converts the protocol number to textual form.
SecurityEvent
| where Activity has 'Windows Filtering Platform'
| where EventID in (5156, 5157)
| parse EventData with * "<Data Name=\"ProcessID\">" netcon_process_id: int "</Data>" *
    "<Data Name=\"Application\">" netcon_process_name: string "</Data>" *
    "<Data Name=\"Direction\">" direction_message_id: string "</Data>" *
    "<Data Name=\"SourceAddress\">" source_ip: string "</Data>" *
    "<Data Name=\"SourcePort\">" src_port: int "</Data>" *
    "<Data Name=\"DestAddress\">" destination_ip: string "</Data>" *
    "<Data Name=\"DestPort\">" dst_port: int "</Data>" *
    "<Data Name=\"Protocol\">" protocol_number: int "</Data>" *
| project
    TimeGenerated,
    Activity,
    SrcIpAddr = source_ip,
    DstIpAddr = destination_ip,
    DstPortNumber = dst_port,
    Protocol = _ASIM_LookupNetworkProtocol(protocol_number),
    netcon_process_name
| sort by DstPortNumber asc
Kusto
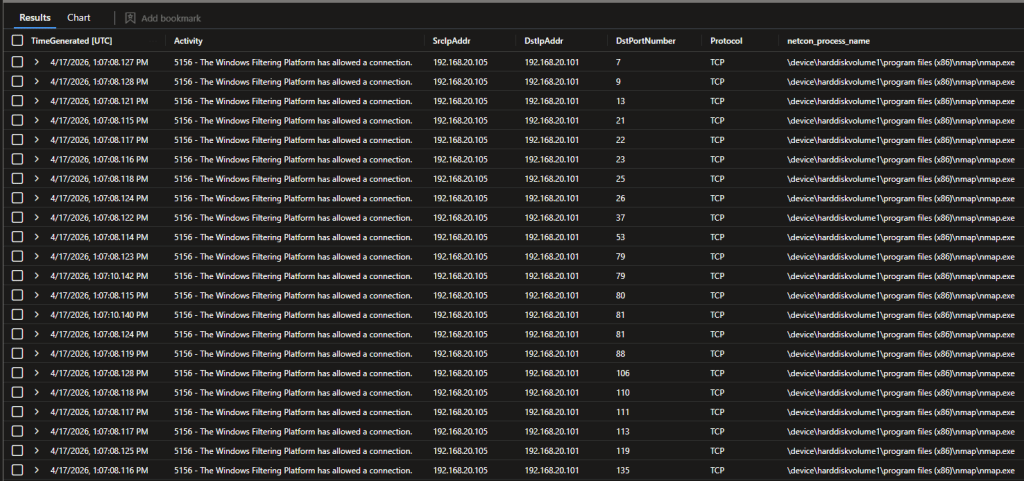
As seen in the screenshot above, the endpoint with IP address 192.168.20.105 attempted connections to a large number of sequential ports on the same destination within a very short period of time. As mentioned previously, this pattern is a strong indicator of vertical scanning.
Summary Rule Development
As explained in the first part of our blog series, the concept of Summary Rules is all about aggregating events with similar characteristics over a defined time period. At the query level (KQL), this is achieved through the summarize operator9, which groups records by selected fields.
For our showcase, we will develop a Summary Rule that summarizes the network traffic, stored in the Data Lake, every 20 minutes. The key design decision is to retain the fields that are necessary for detection use cases. Since network scanning is identified through deviations in expected traffic flow, the summary must preserve the minimum set of attributes required to detect this pattern:
- Source IP address
- Destination IP address
- Destination port
- Protocol
Based on the above, we will develop the logic for our Summary Rule that aggregates events by source IP, destination port, and protocol. Each aggregated record will also store the related destination IP addresses as a set for reference.
SecurityEvent
| where Activity has 'Windows Filtering Platform'
| where EventID in (5156, 5157)
| parse EventData with * "<Data Name=\"ProcessID\">" netcon_process_id: int "</Data>" *
    "<Data Name=\"Application\">" netcon_process_name: string "</Data>" *
    "<Data Name=\"Direction\">" direction_message_id: string "</Data>" *
    "<Data Name=\"SourceAddress\">" source_ip: string "</Data>" *
    "<Data Name=\"SourcePort\">" src_port: int "</Data>" *
    "<Data Name=\"DestAddress\">" destination_ip: string "</Data>" *
    "<Data Name=\"DestPort\">" dst_port: int "</Data>" *
    "<Data Name=\"Protocol\">" protocol_number: int "</Data>" *
| project
    TimeGenerated,
    SrcIpAddr = source_ip,
    DstIpAddr = destination_ip,
    DstPortNumber = dst_port,
    Protocol = _ASIM_LookupNetworkProtocol(protocol_number)
| summarize
    min_timegenerated = min(TimeGenerated),
    max_timegenerated = max(TimeGenerated),
    make_set(DstIpAddr)
    by
    SrcIpAddr,
    DstPortNumber,
    Protocol
| extend
    EventVendor = 'Microsoft',
    EventProduct = 'Windows Filtering Platform'
Kusto
As shown in the screenshot below, the KQL logic produces the expected summary output. Alongside the key fields required for detection, it also retains useful contextual information, such as the earliest and latest timestamps for connections from a given source IP to a destination port, as well as the EventVendor and EventProduct fields.

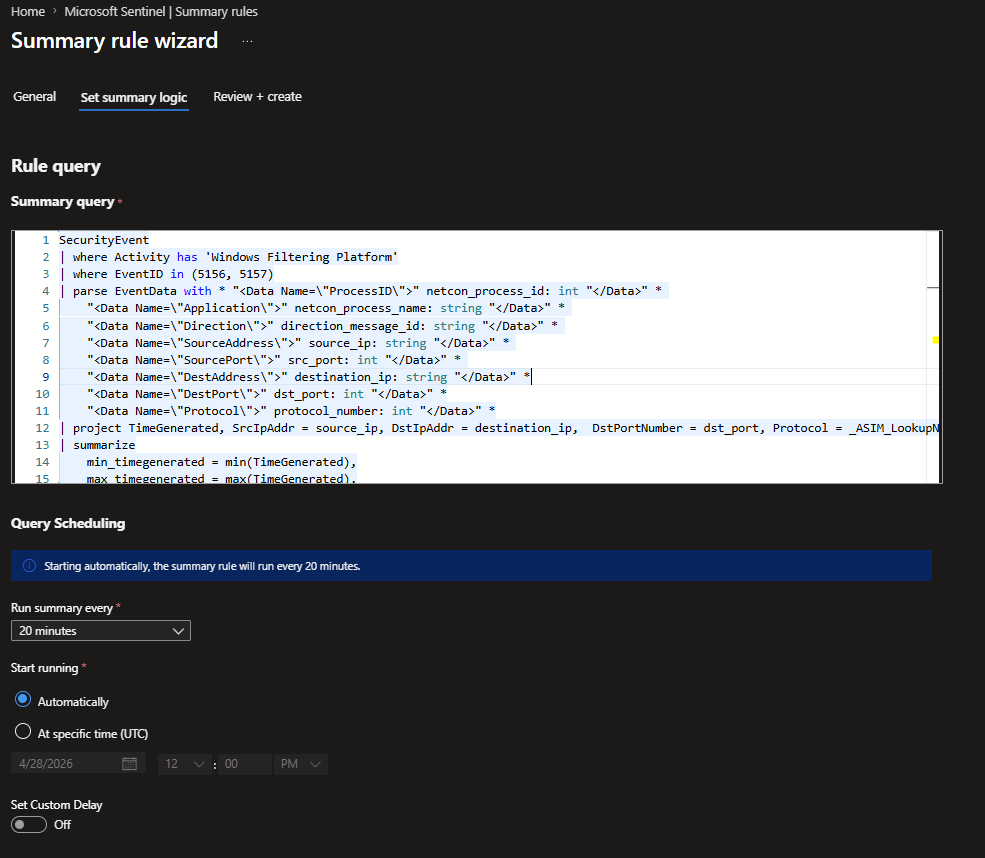
Creating a Summary Rule in Microsoft Sentinel is a relatively simple process. Beyond specifying the rule name, description and query, the main configuration choices are the destination table and the execution frequency. For this implementation we recommend a 20-minute interval, which is the minimum supported value. This provides the fastest possible refresh cycle for the aggregated data while helping avoid execution failures.
The screenshots below show the Summary Rule creation wizard in Microsoft Sentinel.

Sentinel ASIM parsers compatibility
While not mandatory, depending on the environment and the detection strategy, Microsoft Sentinel’s Advanced Security Information Model (ASIM)10 can be used to normalize data across different technologies of the same type.
Microsoft and the wider community provide built-in content11, including normalization parsers, for multiple technologies. However, our custom solution does not integrate with these parsers out of the box, so we will need to develop our own to maintain ASIM compatibility. Microsoft Sentinel makes this process simple, as ASIM parsers are effectively KQL functions. In practice, this means we can save the parser logic as a function, assign it a name (ASim_NetworkSession_Custom_SummaryEvents in our implementation) and define any parameters if needed. Once saved, the parser can be called directly from KQL.
In this implementation, we take advantage of ASIM parsers to reconstruct the events at query time. Also, we will follow ASIM naming conventions, just as we did earlier in the summary rule logic. This will keep the stage of applying the detection logic on the aggregated events simpler and allow Analytic Rules to continue leveraging the ASIM abstraction layer.
// ASim_NetworkSession_Custom_SummaryEvents
let Parser=(disabled: bool=false) {
    wfp_summary_events_CL   // The summary rule destination table name
    | project-rename
        NetworkProtocol = Protocol
    | extend
        EventType = 'NetworkSession',
        EventSchema = 'NetworkSession',
        TimeGenerated = min_timegenerated,
        NetworkProtocol = toupper(NetworkProtocol)
    | mv-expand set_DstIpAddr
    | extend DstIpAddr = tostring(set_DstIpAddr)
    | project-away _*, set_*, min_timegenerated, max_timegenerated
};
  Parser (disabled=disabled)
Kusto

As shown above, by using ASim_NetworkSession_Custom_SummaryEvents, we were able to preserve the ASIM field naming convention while also expanding the list of destination IP addresses in each record, effectively generating a separate event for every item in the set. The KQL operator that enables this is mv-expand12.
To complete the integration, we also need to register our custom parser within the ASIM configuration.
// ASim_NetworkSessionCustom
union isfuzzy=true
// Add all custom parsers here
ASim_NetworkSession_Custom_SummaryEvents
Kusto
Once that is done, we can use _ASim_NetworkSession, which in turn will reconstruct the aggregated fields on the fly and provide the normalized output.
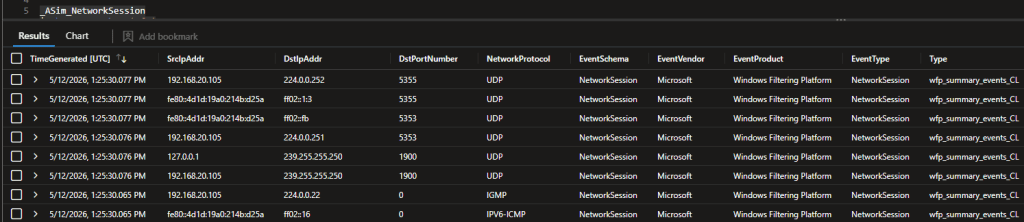
A limitation introduced by the aggregation and reconstruction process is timestamp accuracy. The reconstructed events do not preserve the exact timestamp of each original connection. Instead, each reconstructed event inherits the minimum timestamp for the aggregated record, TimeGenerated = min_timegenerated.
Analytic Rule Development
In the last step of the implementation, we apply the following detection logic within the query of an Analytic Rule, which generates alerts for scanning activity. This is also the stage where we validate that the overall solution still supports the detection outcome, ensuring that cost optimization does not come at the expense of detection capability.
let SupportedEventProducts = dynamic(['Windows Filtering Platform']);
let PortScanningPortsThreshold = 500;
_ASim_NetworkSession
| where EventProduct in~ (SupportedEventProducts)
| where SrcIpAddr != '' and DstIpAddr != ''
| where NetworkProtocol has "tcp"
| summarize
    AttemptedPorts=dcount(DstPortNumber),
    AttemptedPortsList=make_set(DstPortNumber),
    AttemptedPortsSetLowerThan1024 = make_set_if(DstPortNumber, DstPortNumber < 1024, 10),
    make_set(EventProduct),
    min(TimeGenerated),
    max(TimeGenerated)
    by SrcIpAddr, DstIpAddr
| extend
    AttemptedPortsList=array_sort_asc(AttemptedPortsList),
    AttemptedPortsSetLowerThan1024Length = array_length(AttemptedPortsSetLowerThan1024)
| where AttemptedPorts > PortScanningPortsThreshold and AttemptedPortsSetLowerThan1024Length > 9
| summarize
    TargetIpAddressesList = make_set(DstIpAddr, 50),
    TargetPortsList = make_set(AttemptedPortsList, 200),
    MinTimeGenerated = min(min_TimeGenerated),
    MaxTimeGenerated = max(max_TimeGenerated)
    by SrcIpAddr
Kusto
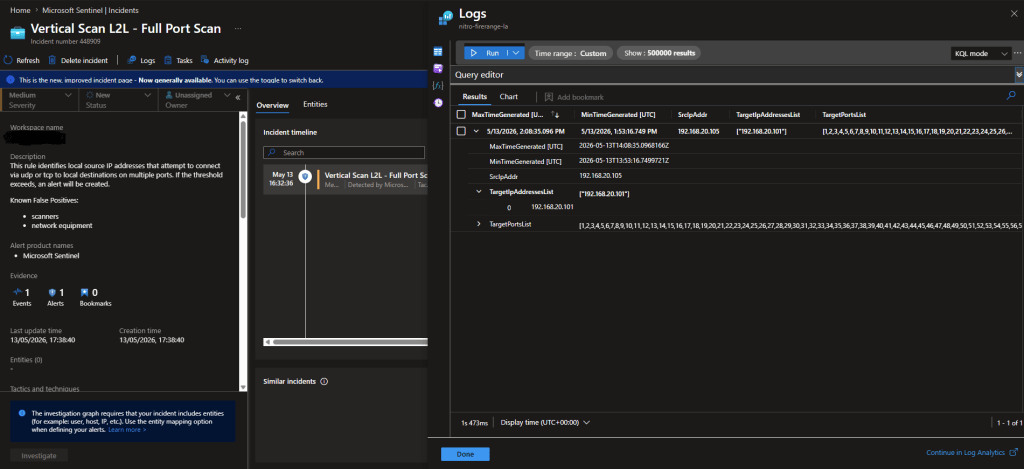
The detection logic is intentionally simple: it counts the distinct destination ports contacted by each source and filters for cases where more than 500 unique ports were reached, including more than 9 ports below 1024.
The screenshot below shows the incident generated by the analytic rule when the logic is triggered.
Cost Comparison
Based on our internal assessments across clients’ environments, this approach can reduce the cost of ingesting firewall network events by roughly 65% to 85% compared to the original ingestion cost. While the final estimate should also include Data Lake ingestion charges and the per-GB cost of analyzing data in that tier13, the overall savings remain substantial.
Wrapping Up
In the second part of this blog series, we demonstrated how we can use Microsoft Sentinel Summary Rules to significantly reduce firewall network traffic ingestion costs while maintaining essential visibility for threat detection and incident response. The approach demonstrated preserves detection capabilities and supports integration with ASIM parsers, ensuring compatibility with analytic rules.
References
- Microsoft, “Microsoft Sentinel pricing” [Online]. Available: https://www.microsoft.com/en-us/security/pricing/microsoft-sentinel/#section-master-oc2d43. ↩︎
- Microsoft, “Microsoft Sentinel cost estimator” [Online]. Available: https://www.microsoft.com/en-us/security/pricing/microsoft-sentinel/cost-estimator. ↩︎
- Microsoft, “Windows Filtering Platform” [Online]. Available: https://learn.microsoft.com/en-us/windows/win32/fwp/windows-filtering-platform-start-page. ↩︎
- Microsoft, “5156(S): The Windows Filtering Platform has permitted a connection” [Online]. Available: https://learn.microsoft.com/en-us/previous-versions/windows/it-pro/windows-10/security/threat-protection/auditing/event-5156. ↩︎
- Microsoft, “5157(F): The Windows Filtering Platform has blocked a connection” [Online]. Available: https://learn.microsoft.com/en-us/previous-versions/windows/it-pro/windows-10/security/threat-protection/auditing/event-5157. ↩︎
- Gordon Lyon, “TCP Connect Scan (-sT)” [Online]. Available: https://nmap.org/book/scan-methods-connect-scan.html. ↩︎
- Microsoft, “parse operator” [Online]. Available: https://learn.microsoft.com/en-us/kusto/query/parse-operator?view=microsoft-fabric. ↩︎
- Microsoft, “Advanced Security Information Model (ASIM) helper functions” [Online]. Available: https://learn.microsoft.com/en-us/azure/sentinel/normalization-functions. ↩︎
- Microsoft, “summarize operator” [Online]. Available: https://learn.microsoft.com/en-us/kusto/query/summarize-operator?view=microsoft-fabric. ↩︎
- Microsoft, “Advanced Security Information Model (ASIM) security content” [Online]. Available: https://learn.microsoft.com/en-us/azure/sentinel/normalization-content. ↩︎
- Github, “Advanced Security Information Model (ASIM)” [Online]. Available: https://github.com/Azure/Azure-Sentinel/tree/master/ASIM. ↩︎
- Microsoft, “mv-expand operator” [Online]. Available: https://learn.microsoft.com/en-us/kusto/query/mv-expand-operator?view=microsoft-fabric. ↩︎
- Microsoft, “Microsoft Sentinel pricing” [Online]. Available: https://www.microsoft.com/en-us/security/pricing/microsoft-sentinel#section-master-oc2d43. ↩︎

Threat Detection Engineer
Christos is a member of NVISO’s CSIRT & SOC Threat Detection Engineering team, where he focuses on Threat Research and Detection Use Cases development.

Threat Detection Engineer
Thodoris is a member of NVISO's CSIRT & SOC Threat Detection Engineering team, primarily focusing on use case research and development. He enjoys exploring advanced security threats and uncovering new insights for effective detection.
如有侵权请联系:admin#unsafe.sh