
In late June, our daily active users in Czechia jumped 310% above their 14-day baseline in a single 2026-7-20 05:8:40 Author: hackernoon.com(查看原文) 阅读量:2 收藏
In late June, our daily active users in Czechia jumped 310% above their 14-day baseline in a single day. Italy hit +371%. Germany +246%. Both landed in the middle of Europe's third heatwave in six weeks – the kind of event that would normally get credited for a usage spike like that.
But heat itself wasn’t what made people open RainViewer. It set the stage. As the heat dome weakened, thunderstorms and heavy rain followed – and that was when usage surged. People weren’t opening the app to confirm that it was hot. They were opening it to answer an immediate question: Is the rain coming toward me, how intense will it be, and when will it pass?
What the data shows
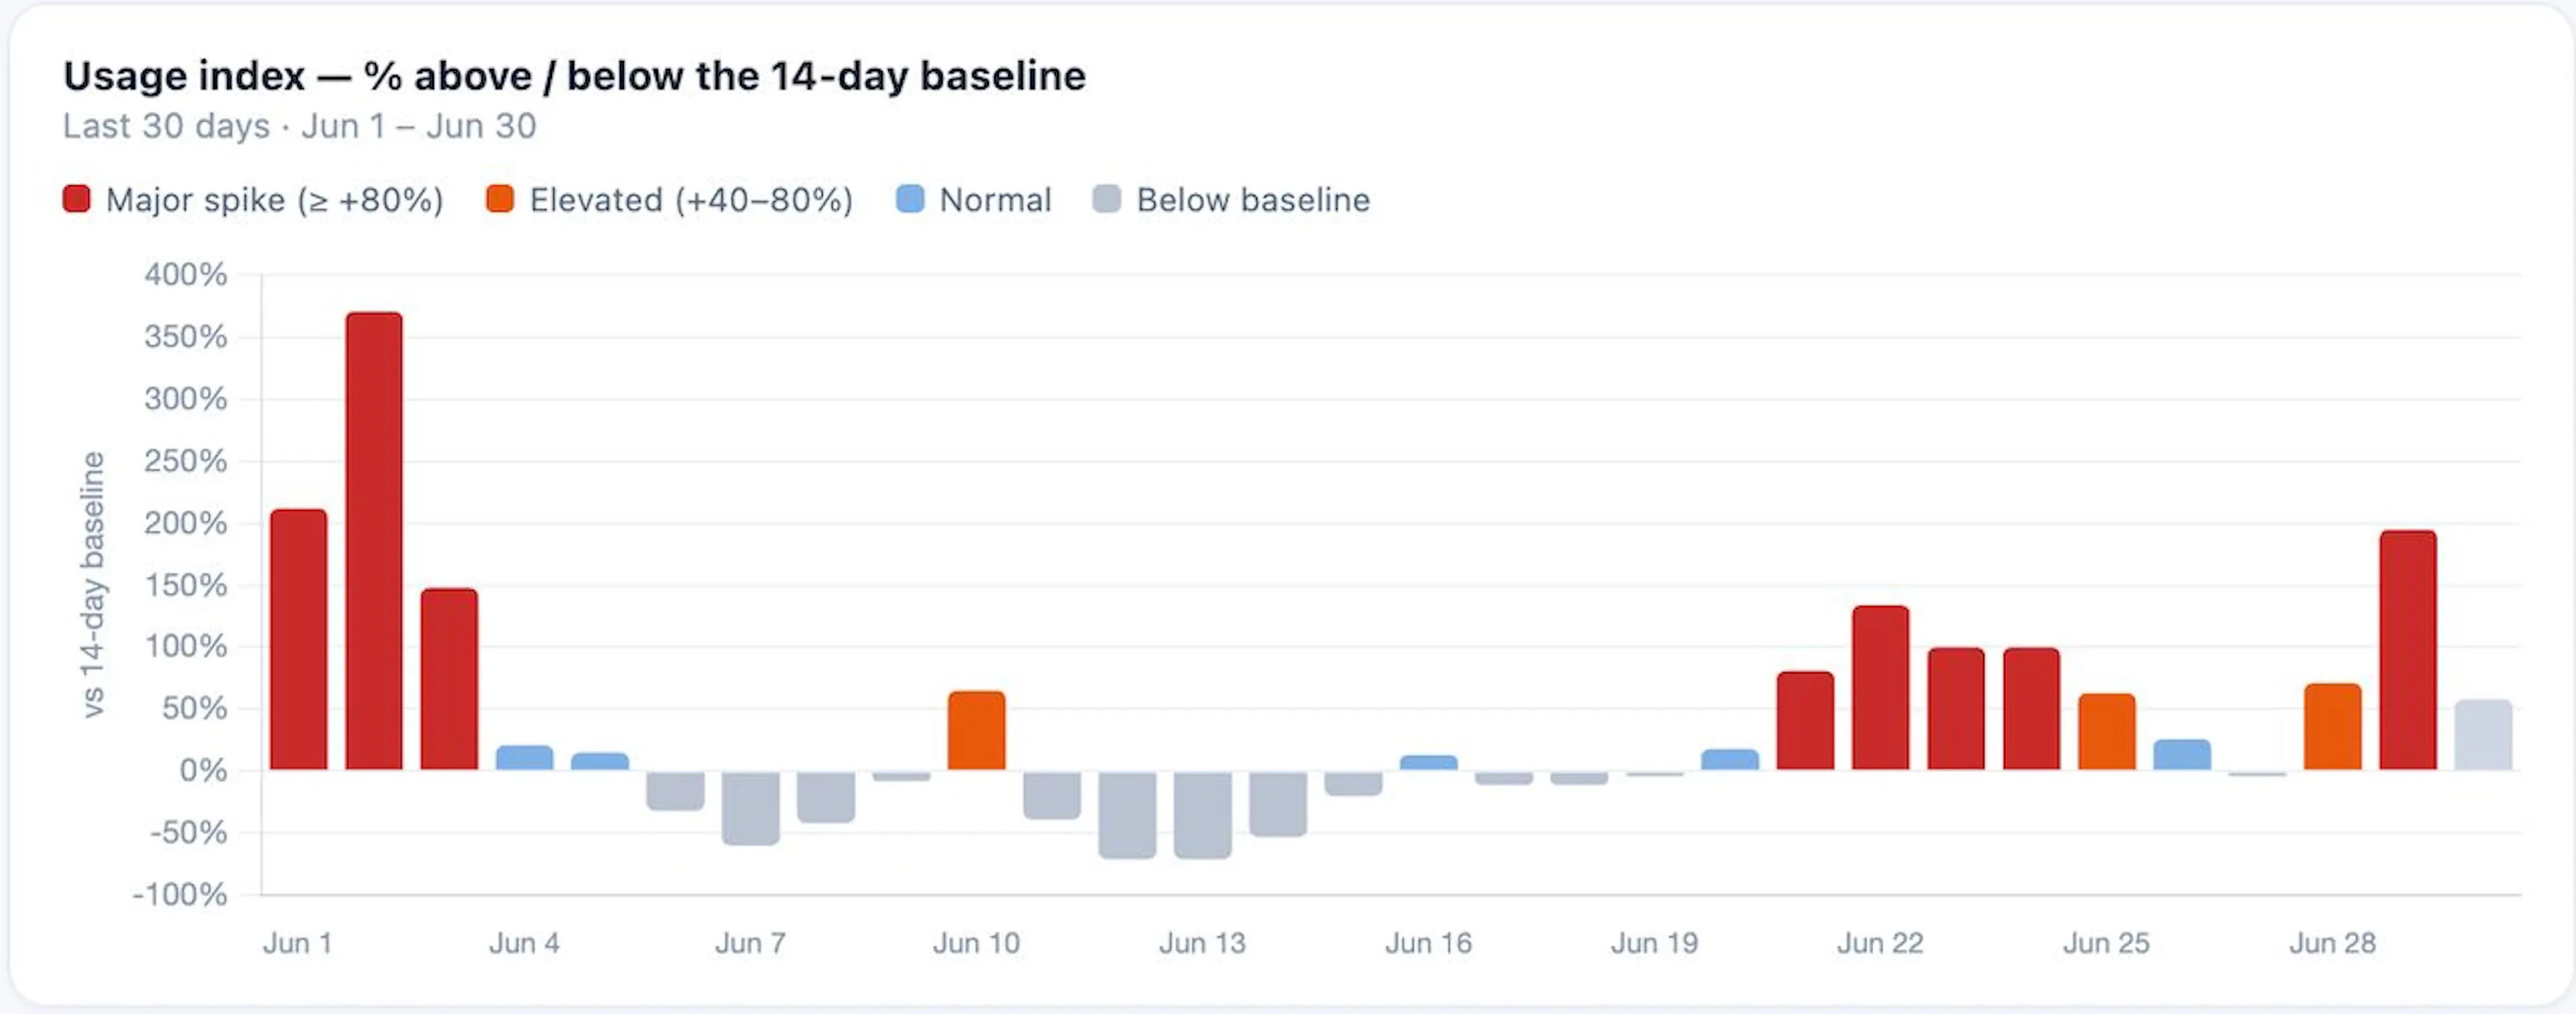
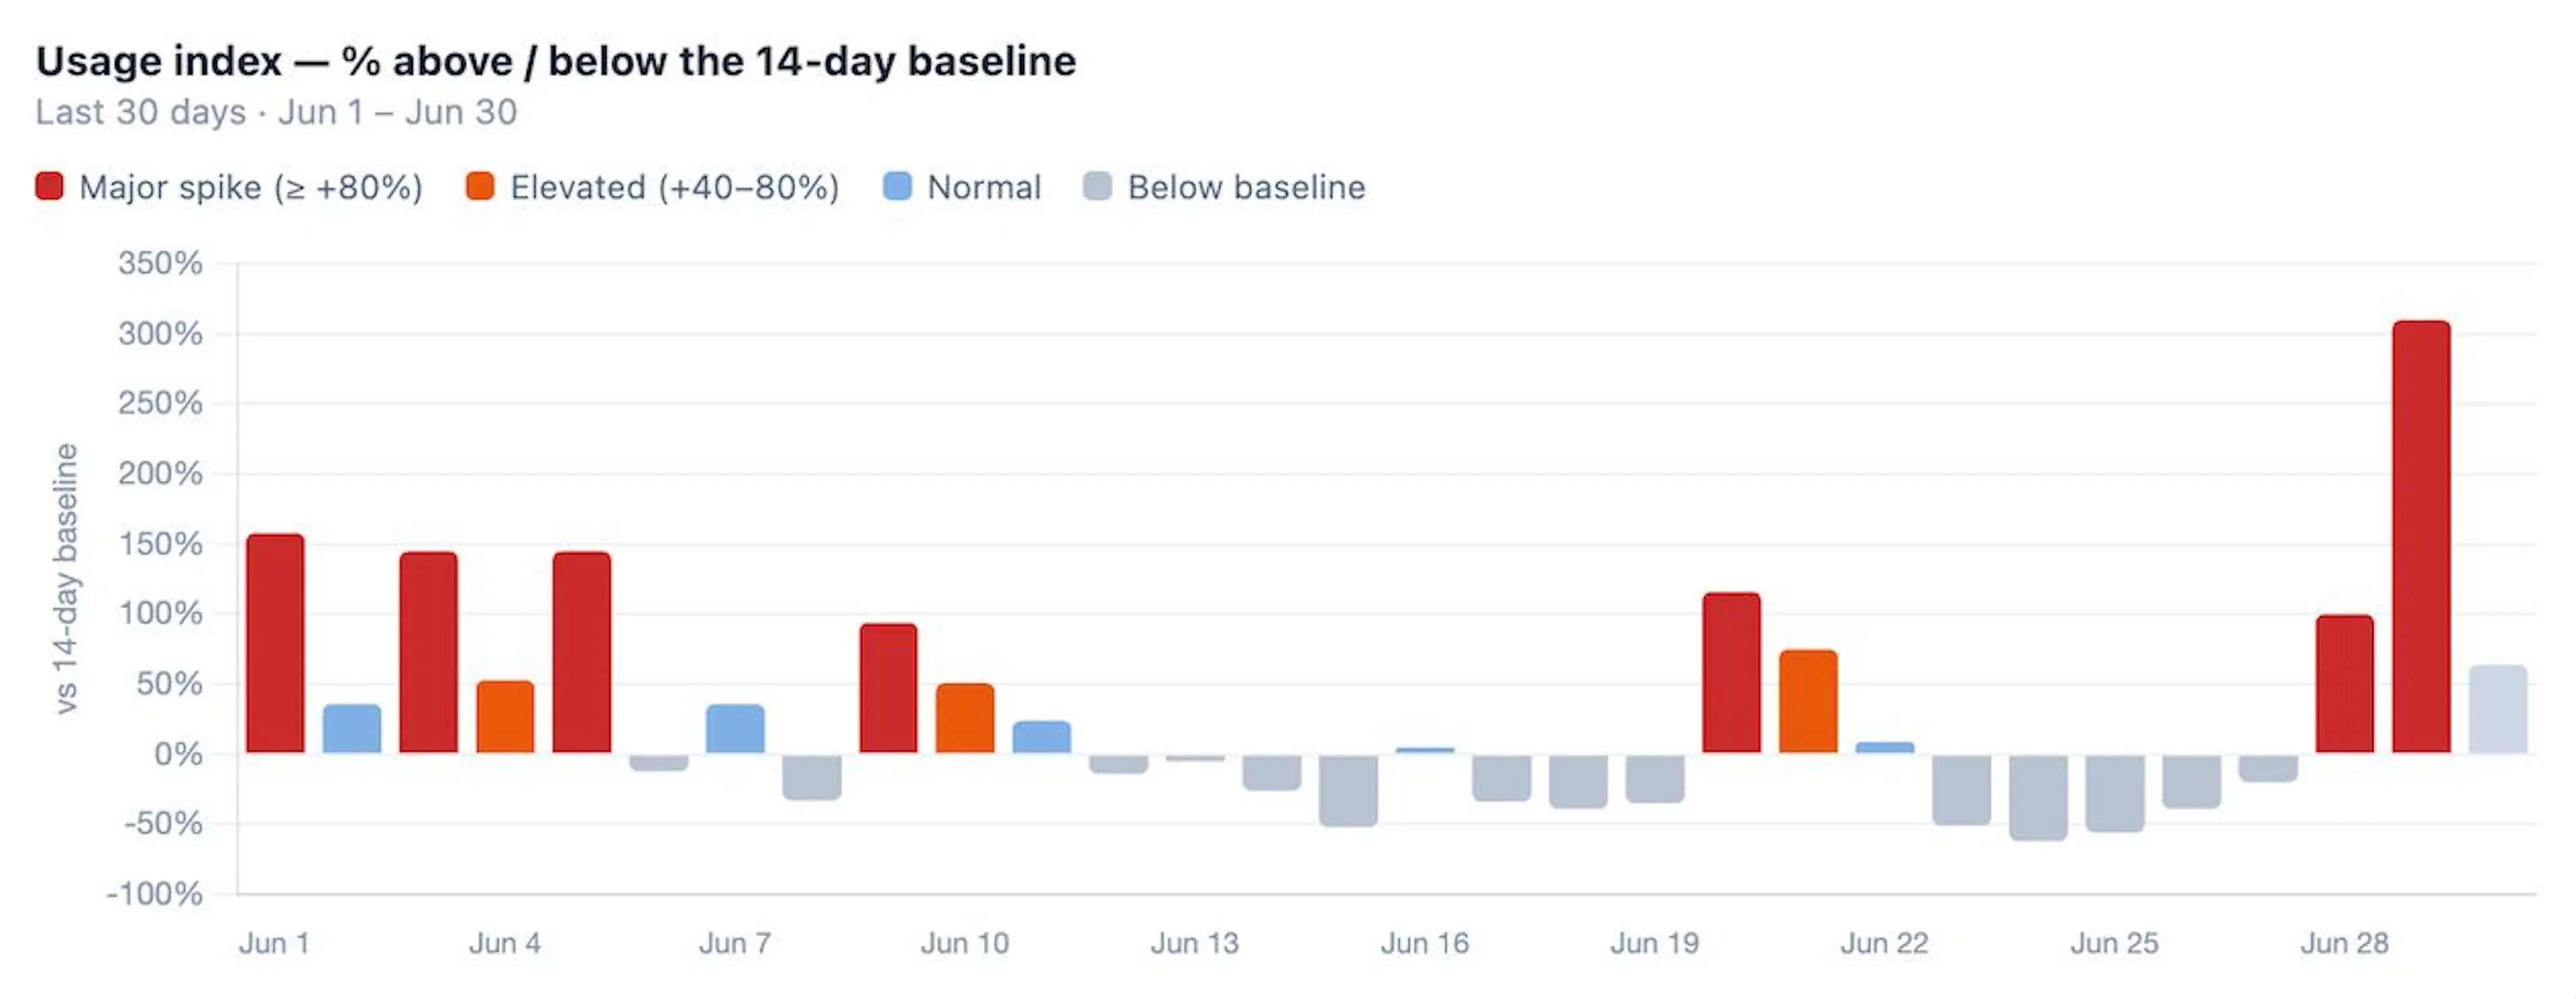
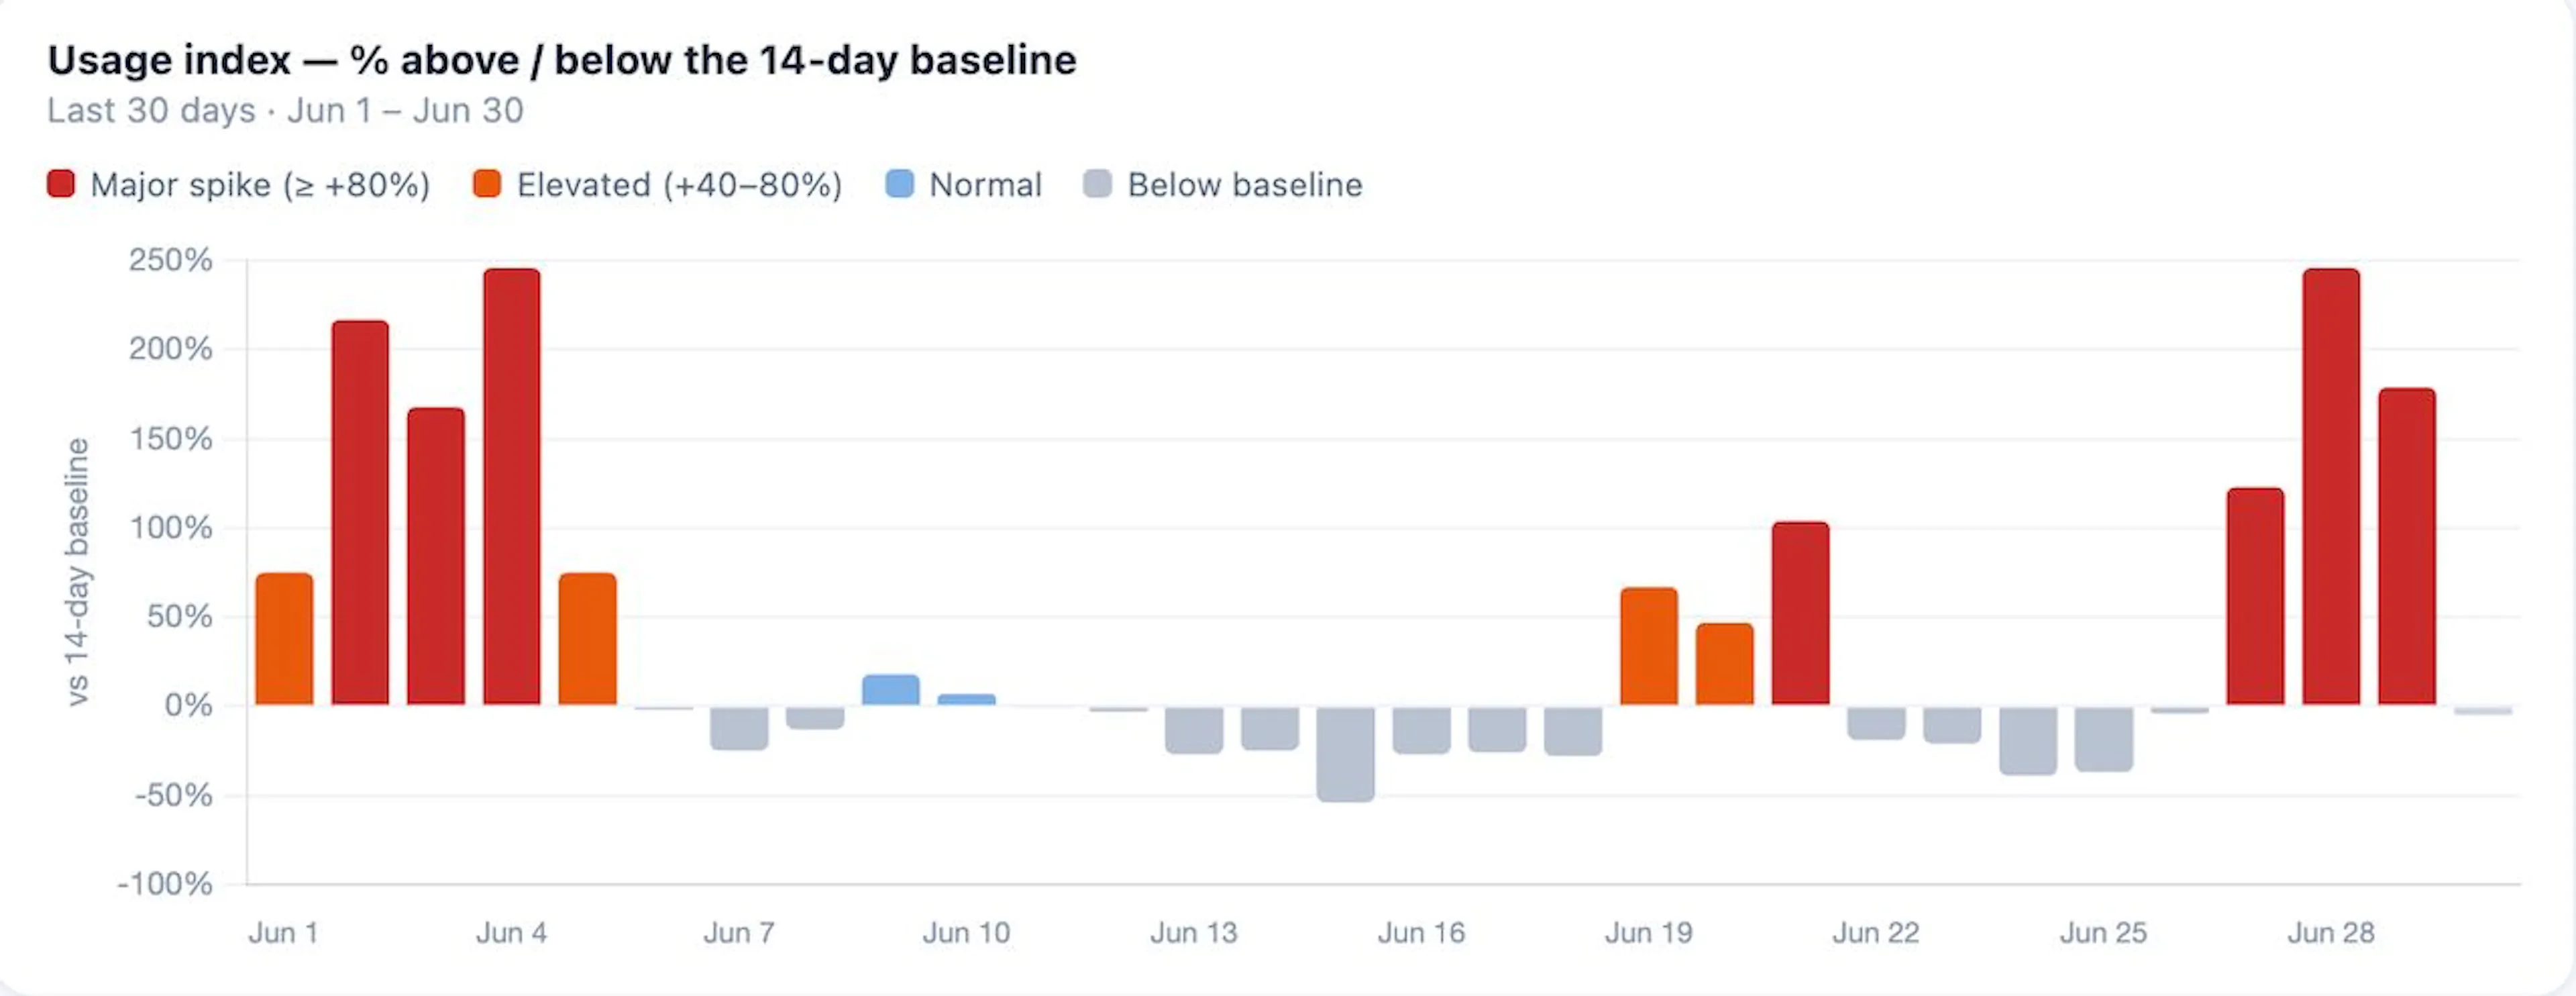
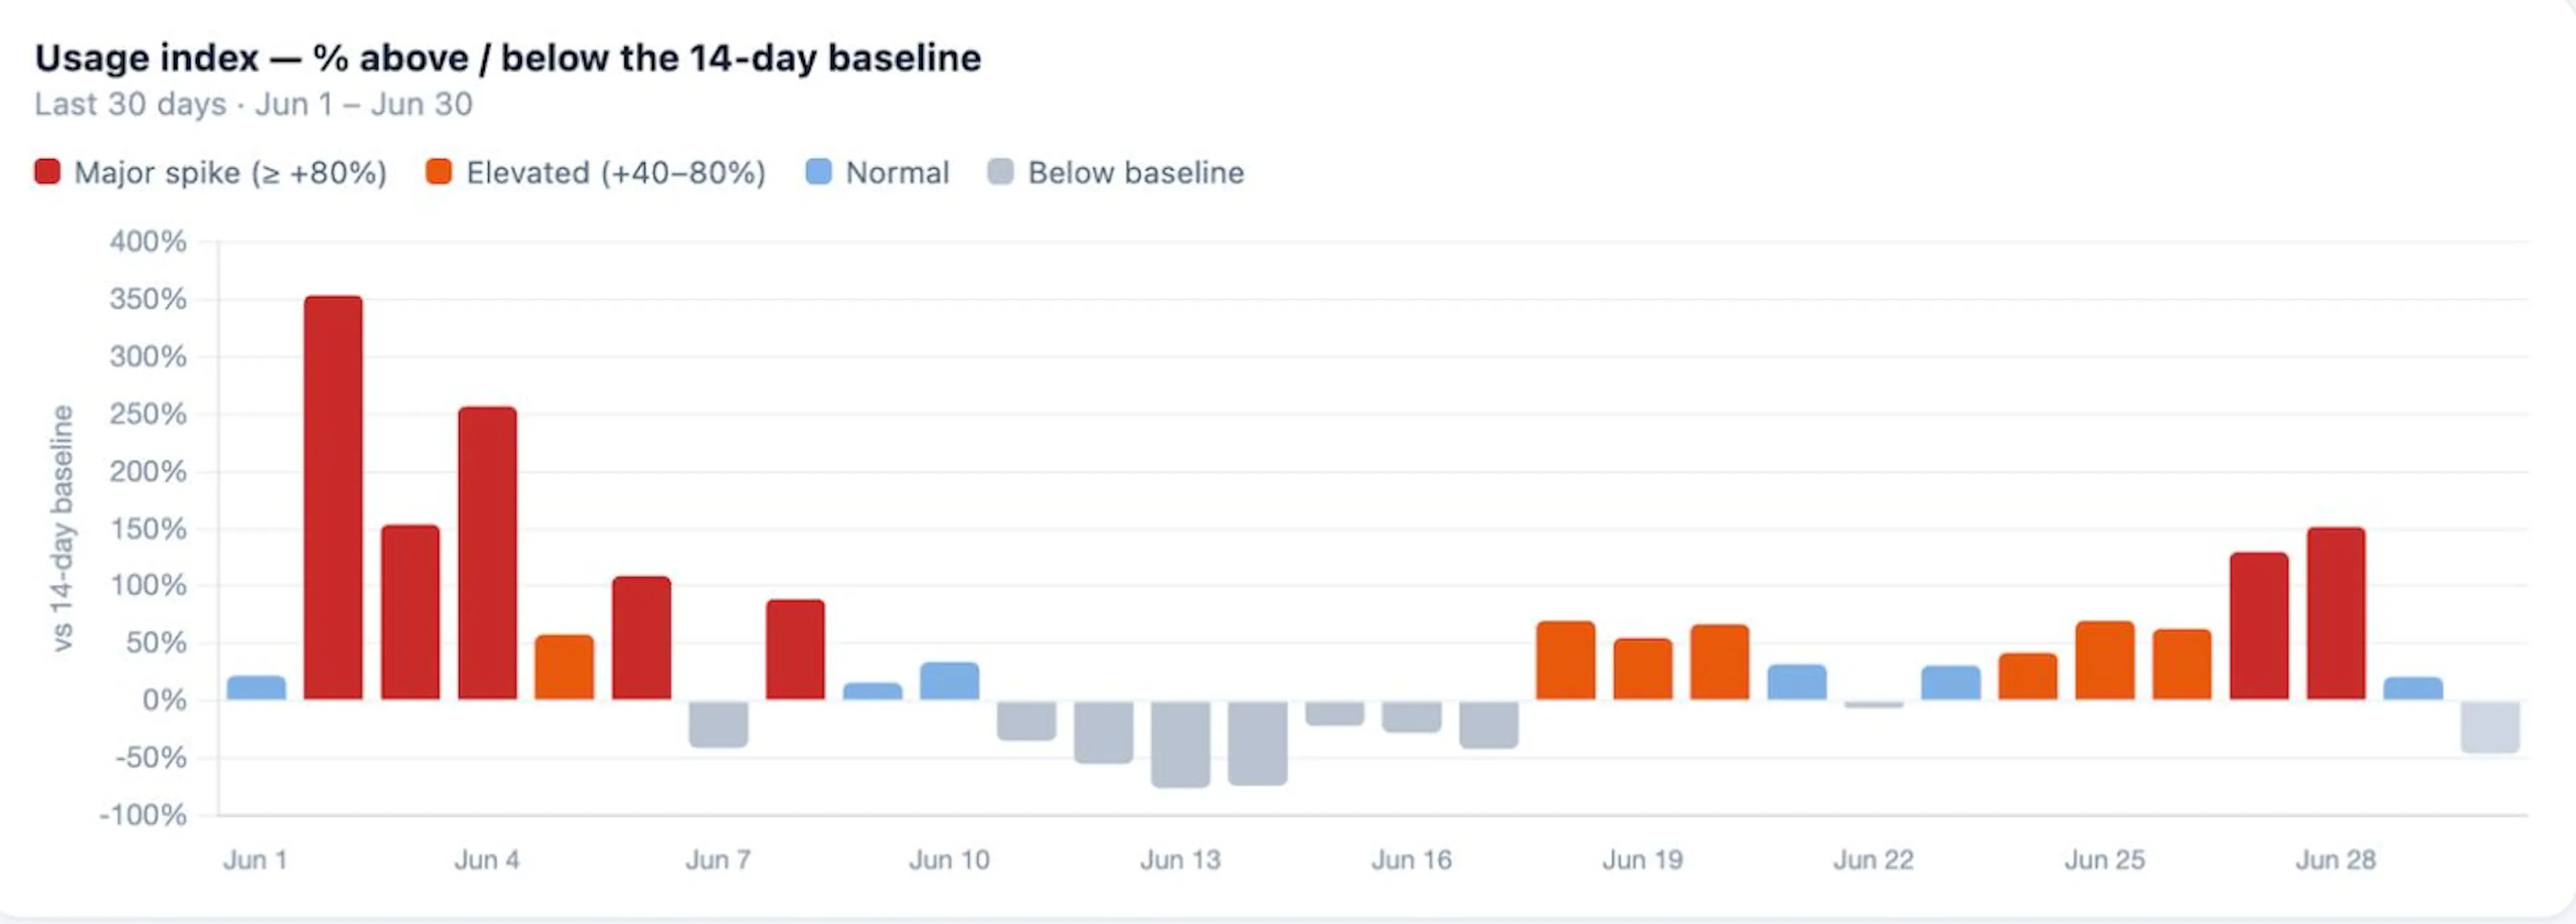
We pulled 30 days of GA4 data (June 1–30) across four markets – France, Italy, Czechia, Germany – comparing daily active users against each day's trailing 14-day baseline. Three of the four show the same double-hump shape: a sharp spike in the first days of June, a quiet, often below-baseline middle stretch, and a second spike in the closing days of the month.
Italy: +371% on Jun 2 (7,774 DAU), a flat middle, then a run of major-spike days from Jun 22–29 topping out at +195%.
 Source: RainViewer
Czechia: three spikes over +140% in the first week, a two-week lull down to ‑62%, then its largest spike of the entire month, +310%, on the very last day.
 Source: RainViewer
Germany: +246% on Jun 4, a mid-month dip to ‑54%, then three straight major-spike days closing the month at +179%, peak DAU 6,830.
 Source: RainViewer
France is the outlier worth naming honestly: it shows the same early-June spike (+354%, Jun 2) and the same mid-month dip (‑76%, Jun 13), but its late-June rebound is milder – the 30-day read closes at a "normal" +21% rather than a major spike. Same underlying pattern, weaker amplitude.
 Source: RainViewer
Four different markets, four different baselines – and in three of four, an unmistakably matching curve. That's a real signal. What it's a signal of is where the harder question starts.
Why we think it's rain, specifically
We don't have a day-by-day precipitation dataset laid over this DAU curve, so we won't claim we've mathematically proven "rain, not heat" from these four charts alone. What we do have is five years of watching this exact pattern from the inside, and a product built around one specific use case.
RainViewer is a rain radar, not a general-purpose weather app. For most of our users, we're not their first weather app – they already have a default forecast app for the seven-day outlook. We're the second one: the one they reach for in the fifteen minutes before or during a downpour, when they need to know if it's about to hit, how hard, and whether it clears in ten minutes or sits over them for an hour.
That's a genuinely different trigger than heat. You don't need an app to tell you it's 37°C outside – your body told you that an hour ago, and it'll keep telling you for the next five days. There's no moment of not-knowing to resolve, so there's no reason to open a radar. A storm that hasn't started yet is the opposite: it's the one weather condition you can't feel coming, and it's exactly the gap our product fills. Everything about how RainViewer is positioned points to rain as the driver – the spike timing is consistent with that theory, even though this dataset alone can't rule out every other variable.
What this means if you're building in weather-tech or climate-tech
The default instinct in this category is to build and market around extremity – the hottest day, the worst storm, the record headline. Our read on this data is that demand tracks volatility, not extremity. A stretch of stable weather, hot or not, produces flat usage in a rain-specific product like ours. A moment where the weather is about to change is what moves the needle – because that's the only moment a forecast actually resolves something the user couldn't already tell for themselves.
With 2026 already on its third European heatwave in six weeks, and each one bringing its own burst of storm activity at the edges, these unstable windows aren't rare anymore – they're becoming a recurring feature of a single season, not once-a-summer events. For product teams in this space, that's worth designing around directly: is your product built to serve someone during a stable extreme, or during the unstable minutes before or after it?
The takeaway
If weather keeps getting more variable year over year, the product question isn't just "how good is your seven-day forecast" – it's "how well do you serve the specific, narrow moment someone can't tell what's about to happen where they are." That's a different design problem than most weather apps are built to solve, and it's the one we'd bet gets more valuable from here.
如有侵权请联系:admin#unsafe.sh