
I’ve been doing projects with various ML topics for multiple years before coming to Text-to-Speech ( 2026-7-22 12:41:34 Author: hackernoon.com(查看原文) 阅读量:6 收藏
I’ve been doing projects with various ML topics for multiple years before coming to Text-to-Speech (Classical ML, NLP, CV). I expected that the general pipeline would be pretty similar: dataset, model, train/val loss, etc.
But after some time, I noticed major differences. TTS carries a whole class of problems that are:
- easy to miss when you start;
- rarely written about;
- and yet quietly shape your day-to-day work.
This is an article about the biggest of them, which I faced while working on smart assistants and TTS services in different big tech companies. This post is about the parts of that job I didn't see coming.
Metrics you can't trust
This is probably the most crucial part. In short, there is no single metric in TTS that you can rely on and say, "Okay, the model has improved." Well, you can rely on it, but with some caveats.
WER and CER
The most obvious approach is to use Word Error Rate (WER) and Character Error Rate (CER).
The process is straightforward:
- We synthesize audio;
- We run it through a speech recognition model;
- We compare it with the original text, calculating the percentage of words (WER) and characters (CER) that contain errors.
So we've got metric values that we can compare between different models. Looks great. The problem is that this only checks the correctness of the text, but not the quality of the audio speech itself. The model can sound unnatural, have a strange intonation, and sound like a robot. However, it may still show good WER and CER.
It is suitable for early filtering and sanity checks, but not as the final quality metric.
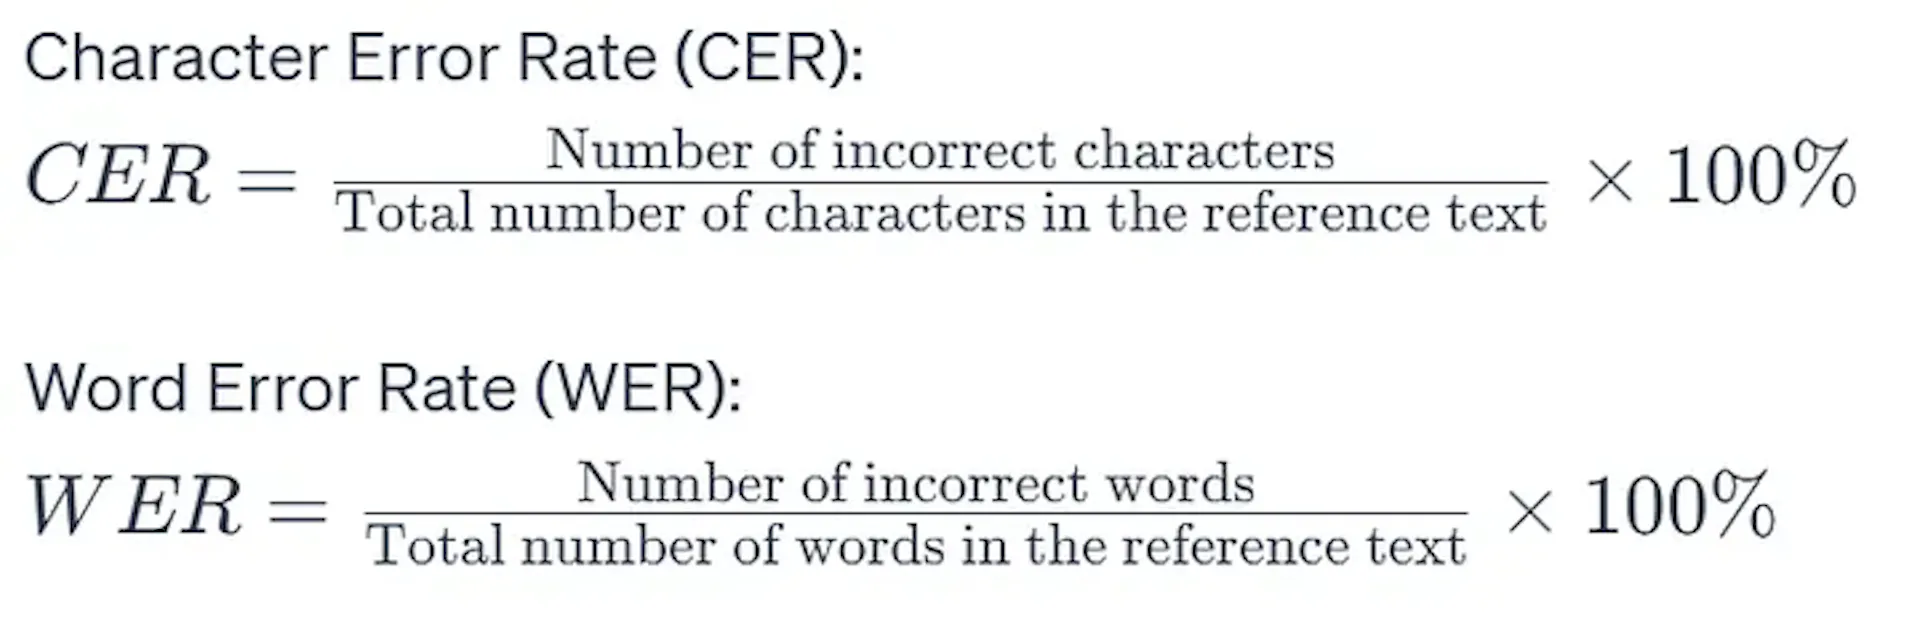 CER & WER formulas: the ratio of errors, over characters or words
Instructions for assessors
Assessor labeling is most often used to calculate metrics of final quality. Next, I will tell you about 2 such metrics that are most often used, but they have one common problem.
The task of evaluating the "quality" of audio speech is not trivial. In the early stages, fixing the most obvious problems (incorrect sounds, audio artifacts, lack of interrogative intonations in questions, etc.) can be not so hard. But when it comes to solving less trivial problems, it gets tough.
I personally rewrote our instructions for assessors. It turned out that they were literally a few lines long before, which is why we could not catch, for example, "unnatural" intonations, or unnatural pauses and poor punctuation handling (in some cases, pauses should be shorter than in others). My new instruction was 3-4 pages long. I had to introduce a scoring system, different types of errors, a priority hierarchy for each type and a detailed description of each with examples.
Because of this, the pool of assessors is greatly narrowed, because not everyone is willing to actually sit down and study a doc that long. And of course it increases the cost of such labeling.
Side-by-Side: the most reliable method, and the most expensive
Side‑by‑side (SBS) comparison. The name explains the concept: we take texts, generate them using two different models, and ask the assessor to vote for the best variant or whether quality is the same.
The best quality metric from my experience, because people can easily find differences between 2 audio samples if they listen to them one-by-one. The main problem - it is relative. It gives an understanding only in the context of 2 specific models.
Worst-case scenario, you will have to calculate SBS for N*(N-1)/2 pairs:
- SBS(model_1, model_2), … , SBS(model_1, model_N);
- SBS(model_2, model_3), … , SBS(model_2, model_N);
- etc.
This rarely happens in real practice, but to find the best model, you will almost always have to calculate >N metrics, which leads to more time and cost for the labeling process.
Also, it is not favored by managers because relative metrics are not always easy to show in presentations.
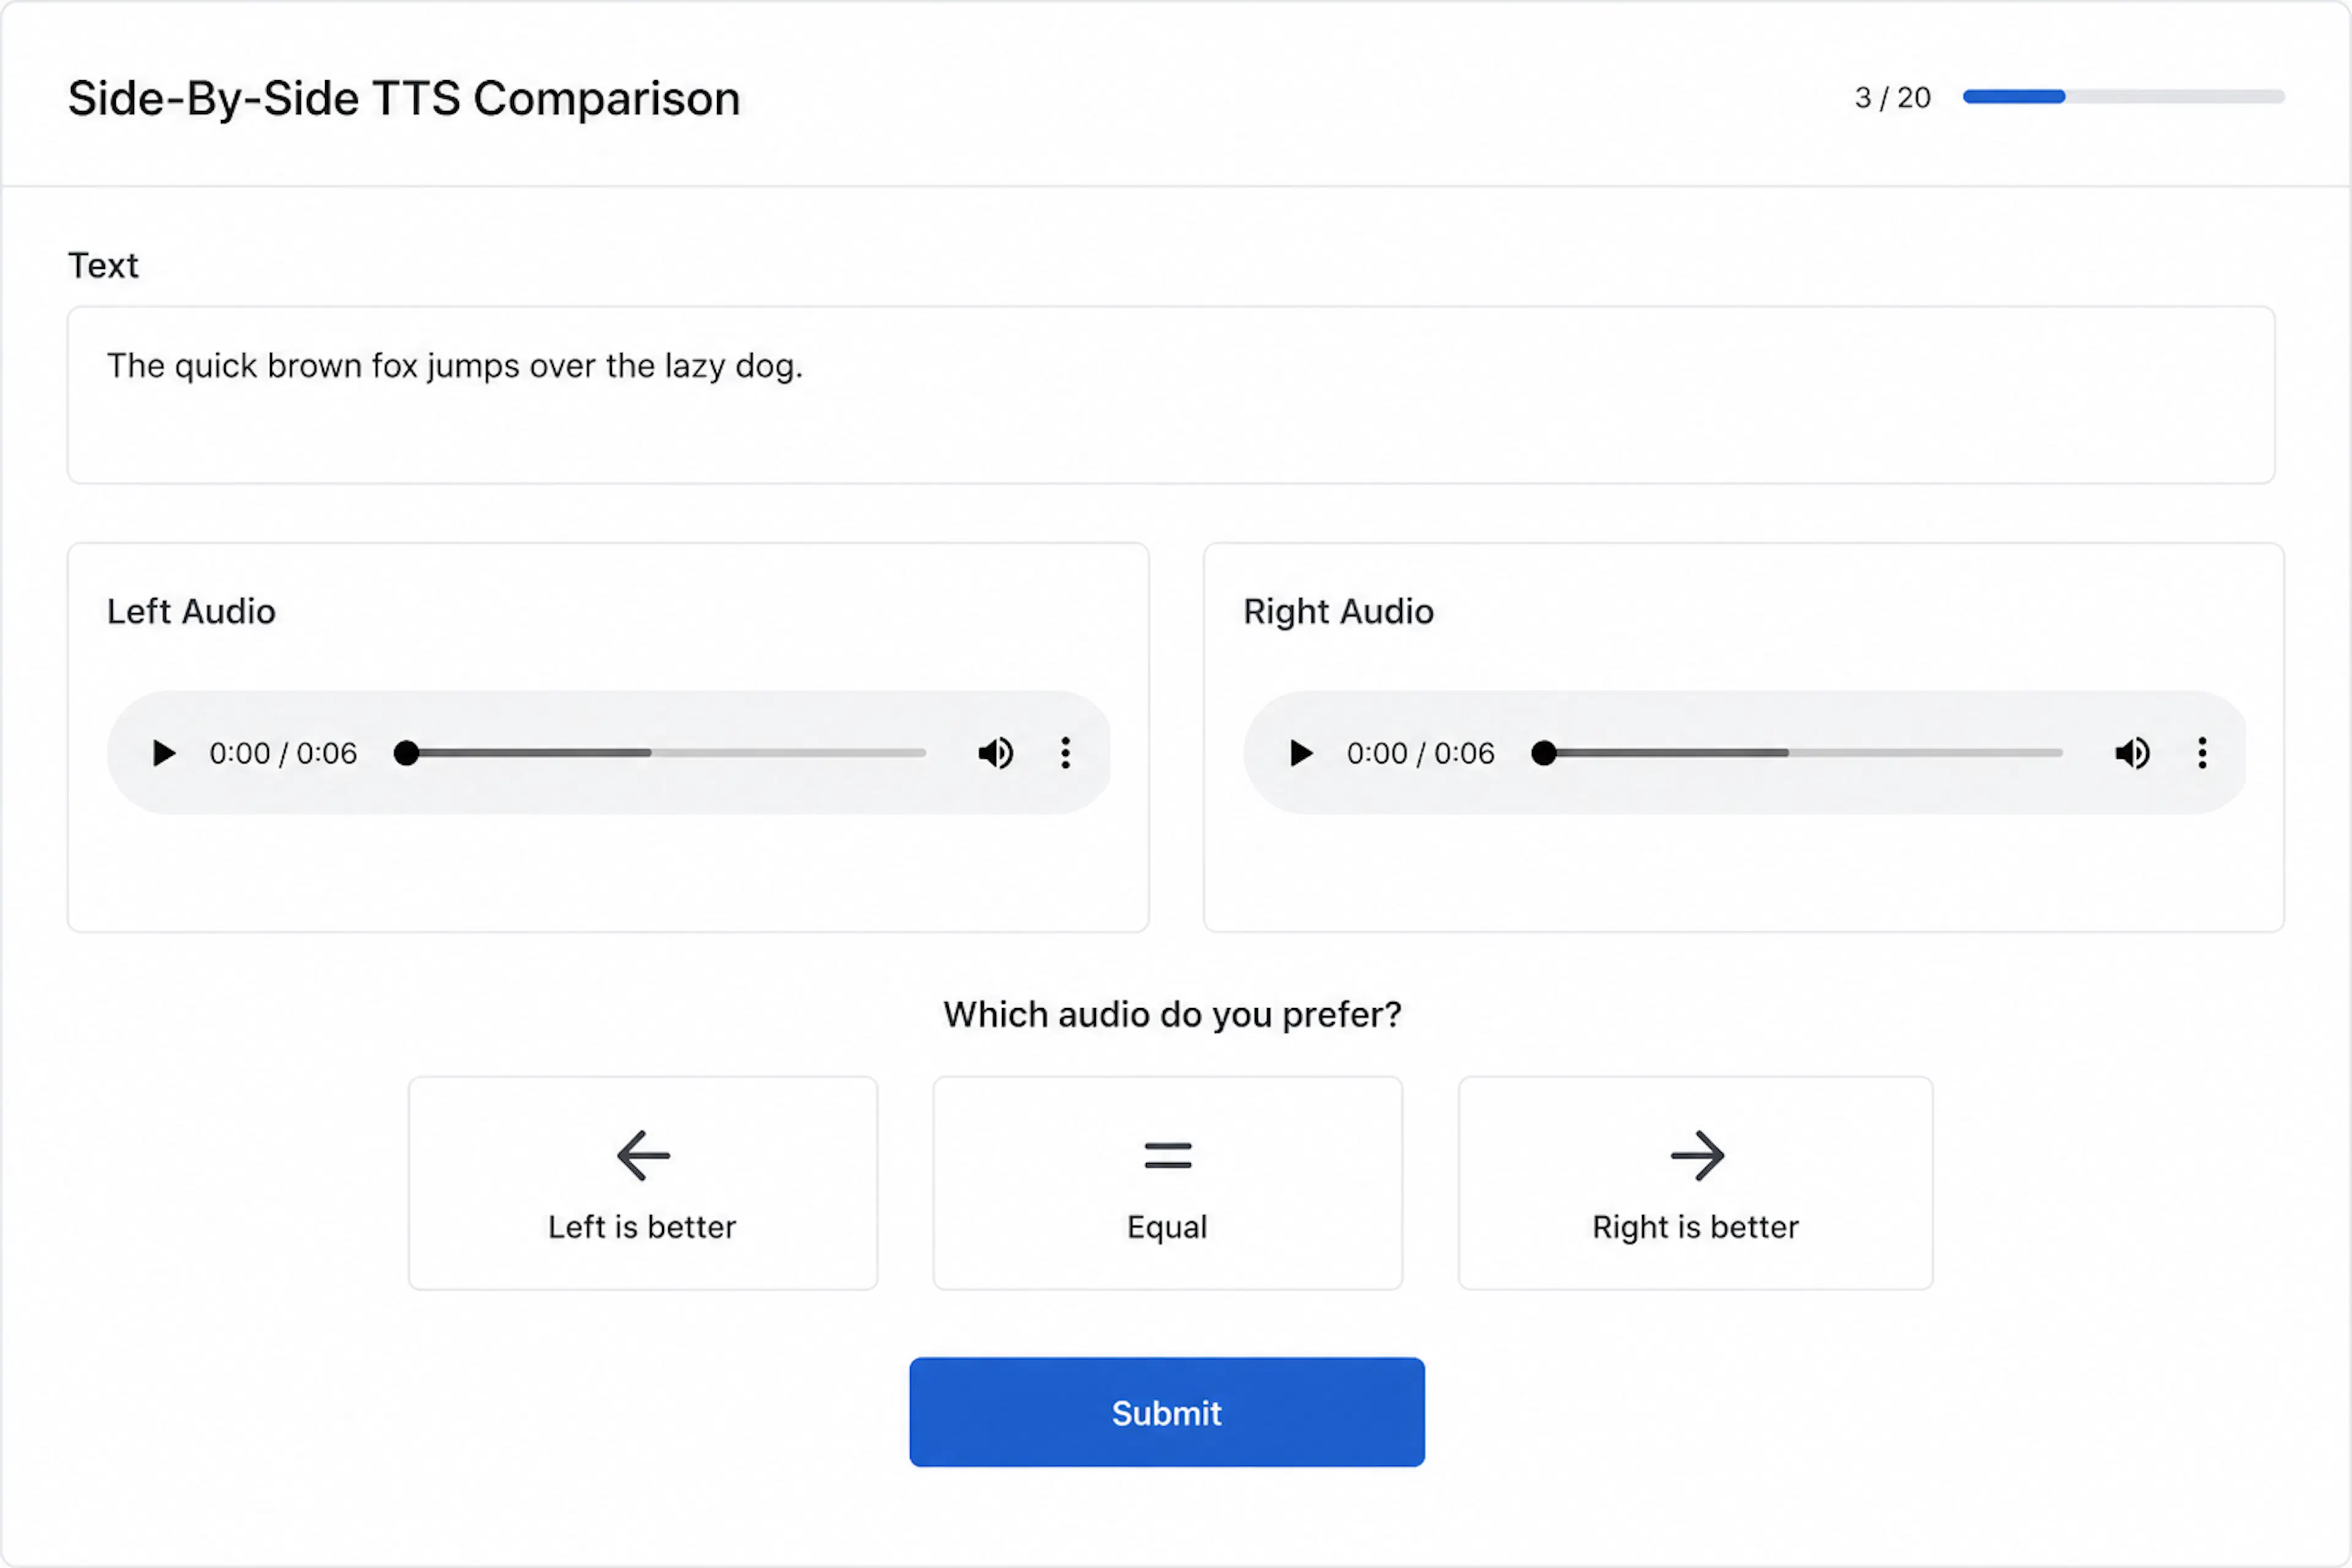 Standard SBS task for assessors
Mean Opinion Score: everyone loves it, but I don't
It would seem that after all the problems of SBS, you want to have an absolute quality metric. And there is such a metric!
Mean Opinion Score (MOS) is a very commonly used metric. It is calculated simply: you give the audio to the assessors, they give a score from 1 to 5, and you calculate the average.
MOS is very popular. Because it is:
- Absolute;
- Understandable;
- Looks good in reports and presentations.
Sounds great. So what is the problem? A lot of noise and a large variance (sometimes more than 1.5 with a maximum score of 5). In my experience, people rate audio quality very poorly "independently."
An analogy for understanding:
- Let's say we have 2 speakers with different voice models;
- If you put two speakers and turn on the audio from the first and second speakers one after the other, the user will tell you which one is better;
- If you give the first speaker to a user for a week, and then the second one, the user will notice the difference only if it is significant.
This analogy did not come from nowhere. According to rumors, one of the top managers in our company regularly placed a competitor's speaker next to ours and tested them according to his ideas of "user requests". It was very difficult to explain that such a test has almost no statistical power. The overall response quality of the device depends on many factors, not just the TTS. But it was even more difficult to explain that with independent listening, the difference would have been much weaker. Of course, he did not want to repeat the experiment according to the second scenario.
This is also why a result like:
- Model A: MOS ≈ 4.0
- Model B: MOS ≈ 4.4
doesn't necessarily tell you much. That gap can be statistically insignificant.
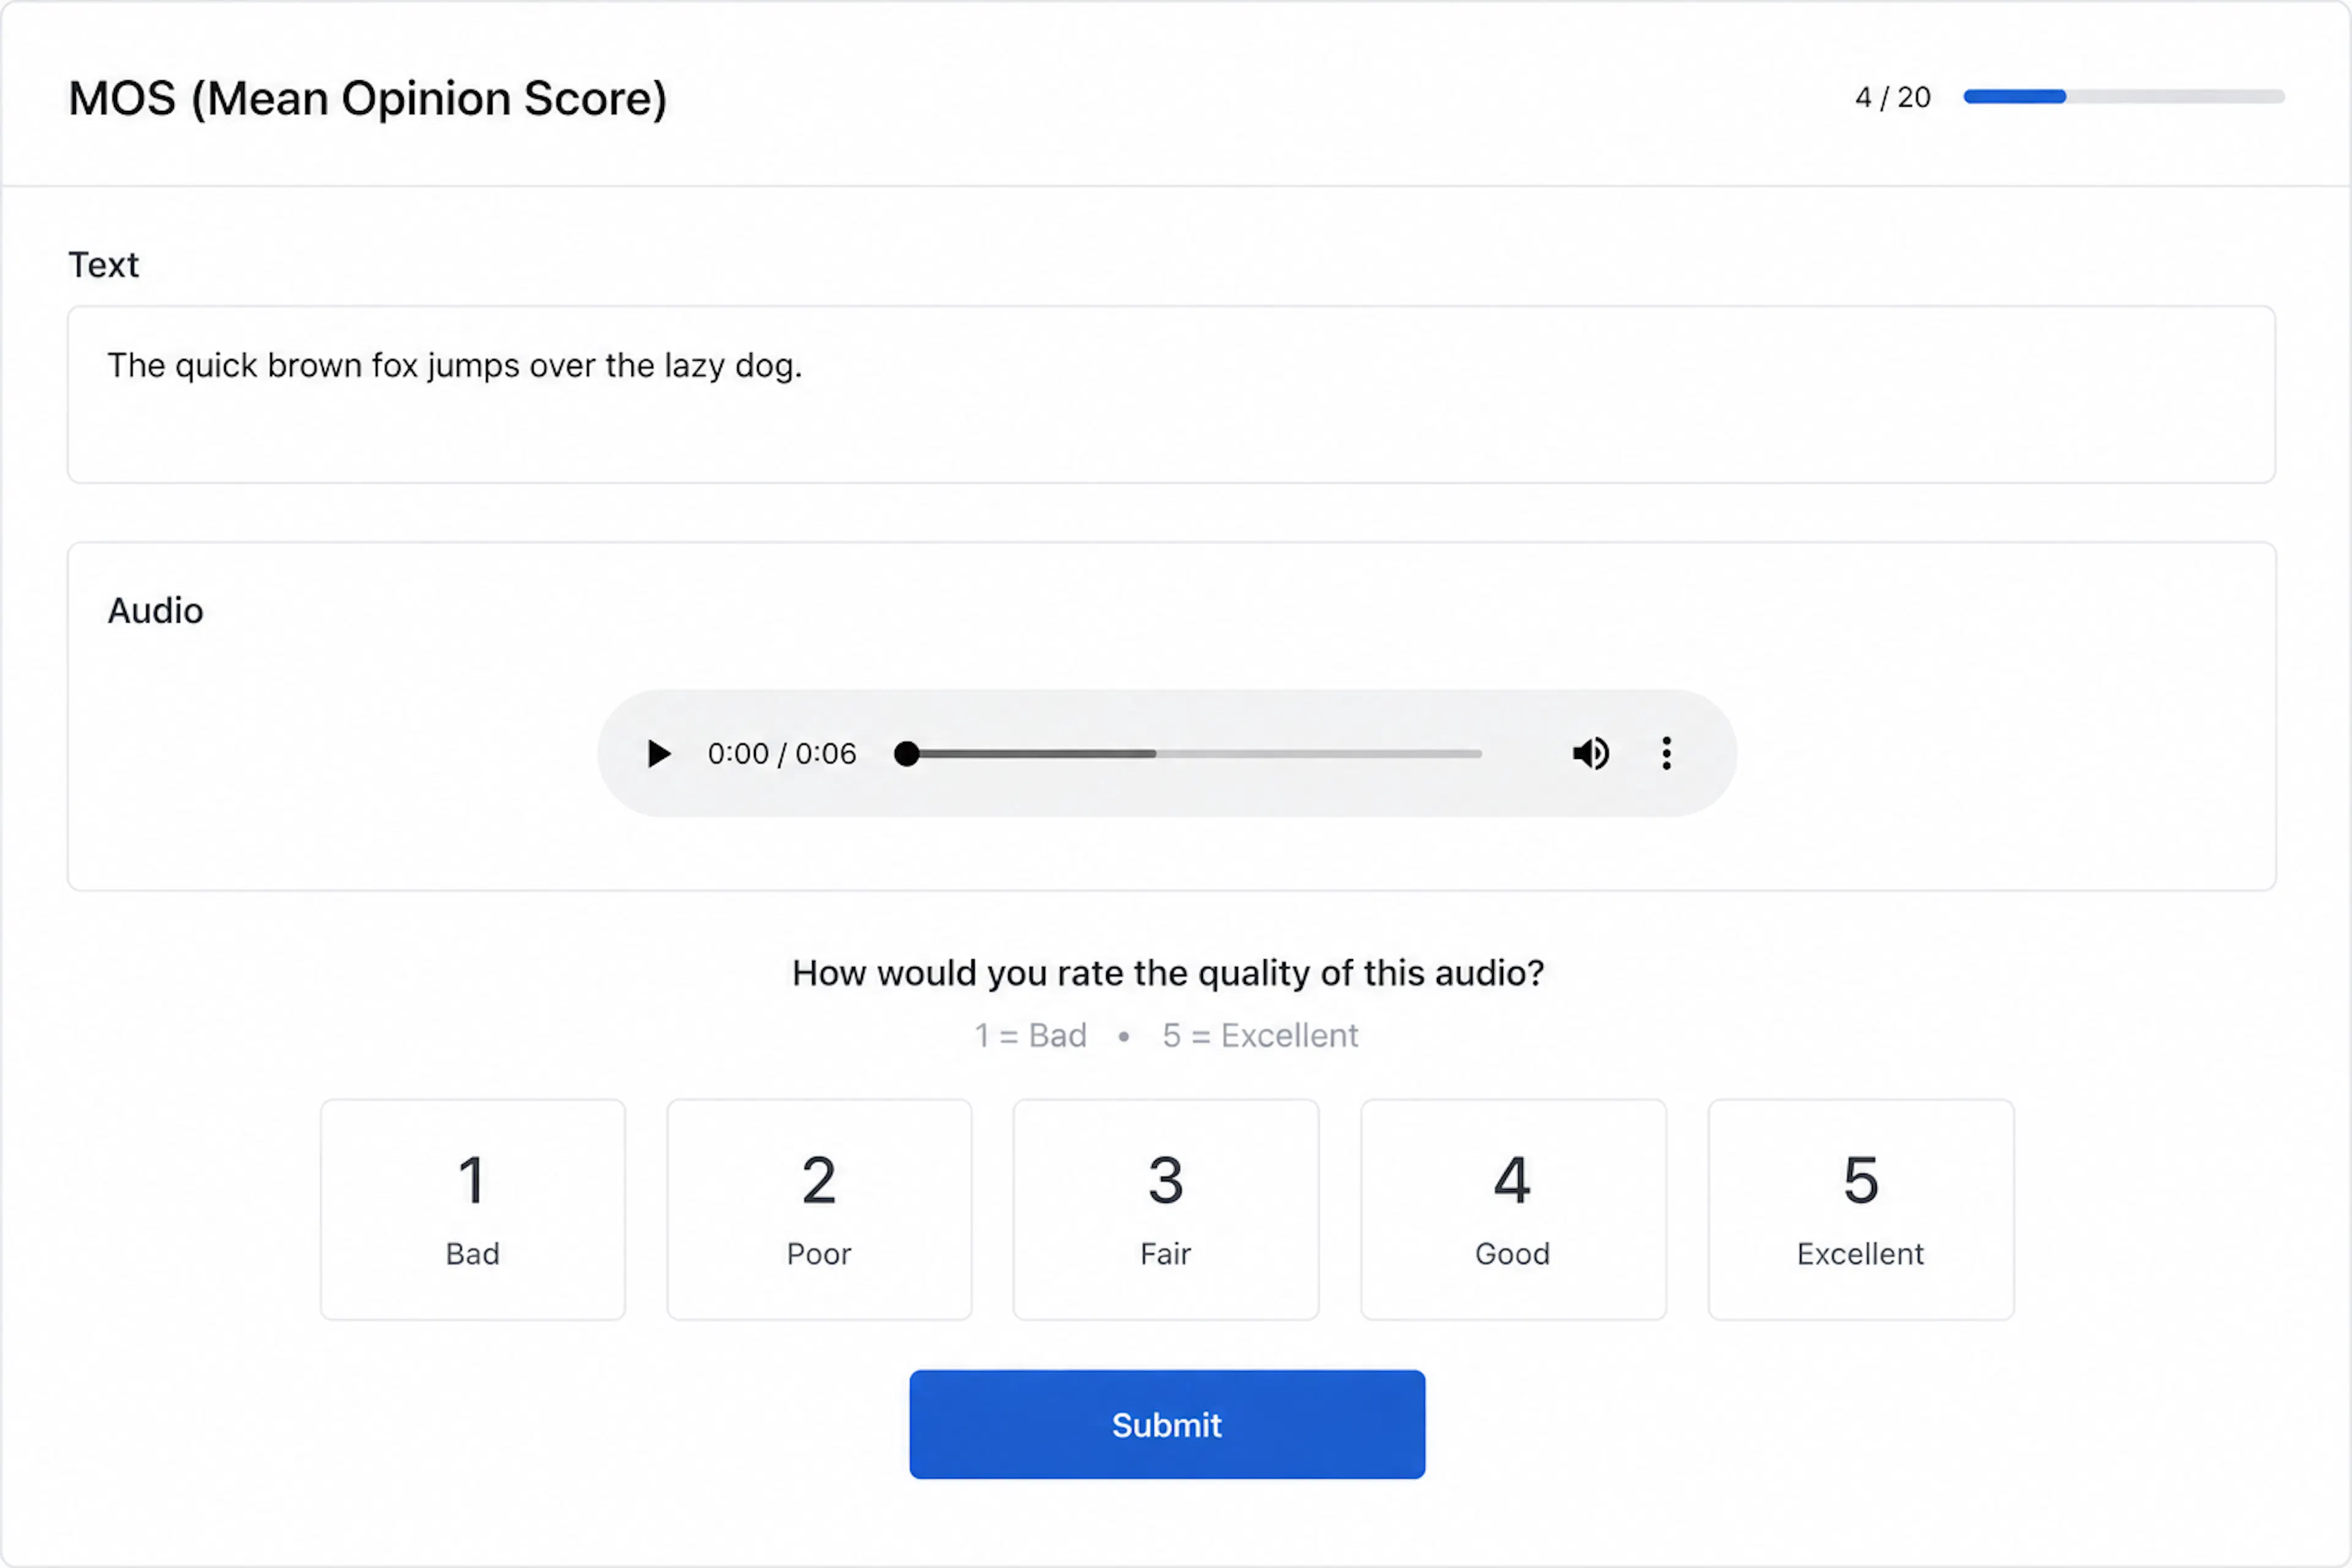 Standard MOS task for assessors
Lower loss doesn't always mean a better result
At the end, let's talk about the loss that we optimize directly during model training.
To simplify, the TTS pipeline looks like this:
Text → Normalization → Mel-spectrograms → Audio
The main work and innovation happens at the step of obtaining a Mel-spectrogram.
We predict this Mel-spectrogram either as a regression task or as a classification task for audio tokens (in newer approaches). And we optimize the usual Loss (MSE in the case of regression, cross entropy in the case of classification).
In the first stages of training, everything goes as usual: the loss decreases, and the quality increases. However, on later steps, from which you will choose a model for comparison with prod, there are often situations like this:
- checkpoint at step 120,000;
- checkpoint at step 150,000;
- the second checkpoint has a smaller loss value.
However, the audio quality is either the same or sometimes even better in the earlier checkpoint.
Because of this, the standard pipeline of taking the best checkpoint based on the loss in the validation phase often doesn't work in TTS. You have to save multiple checkpoints, generate multiple audio samples (usually 10-20 for each checkpoint), and listen to them.
Yes, manual listening of tens (sometimes hundreds) of audio samples. I've listened to so many variations of Wikipedia paragraphs about famous poets and historical events that I can still recite them by heart. This means that validation becomes partially manual, at least when selecting checkpoints for calculating final quality metrics and comparing them with production.
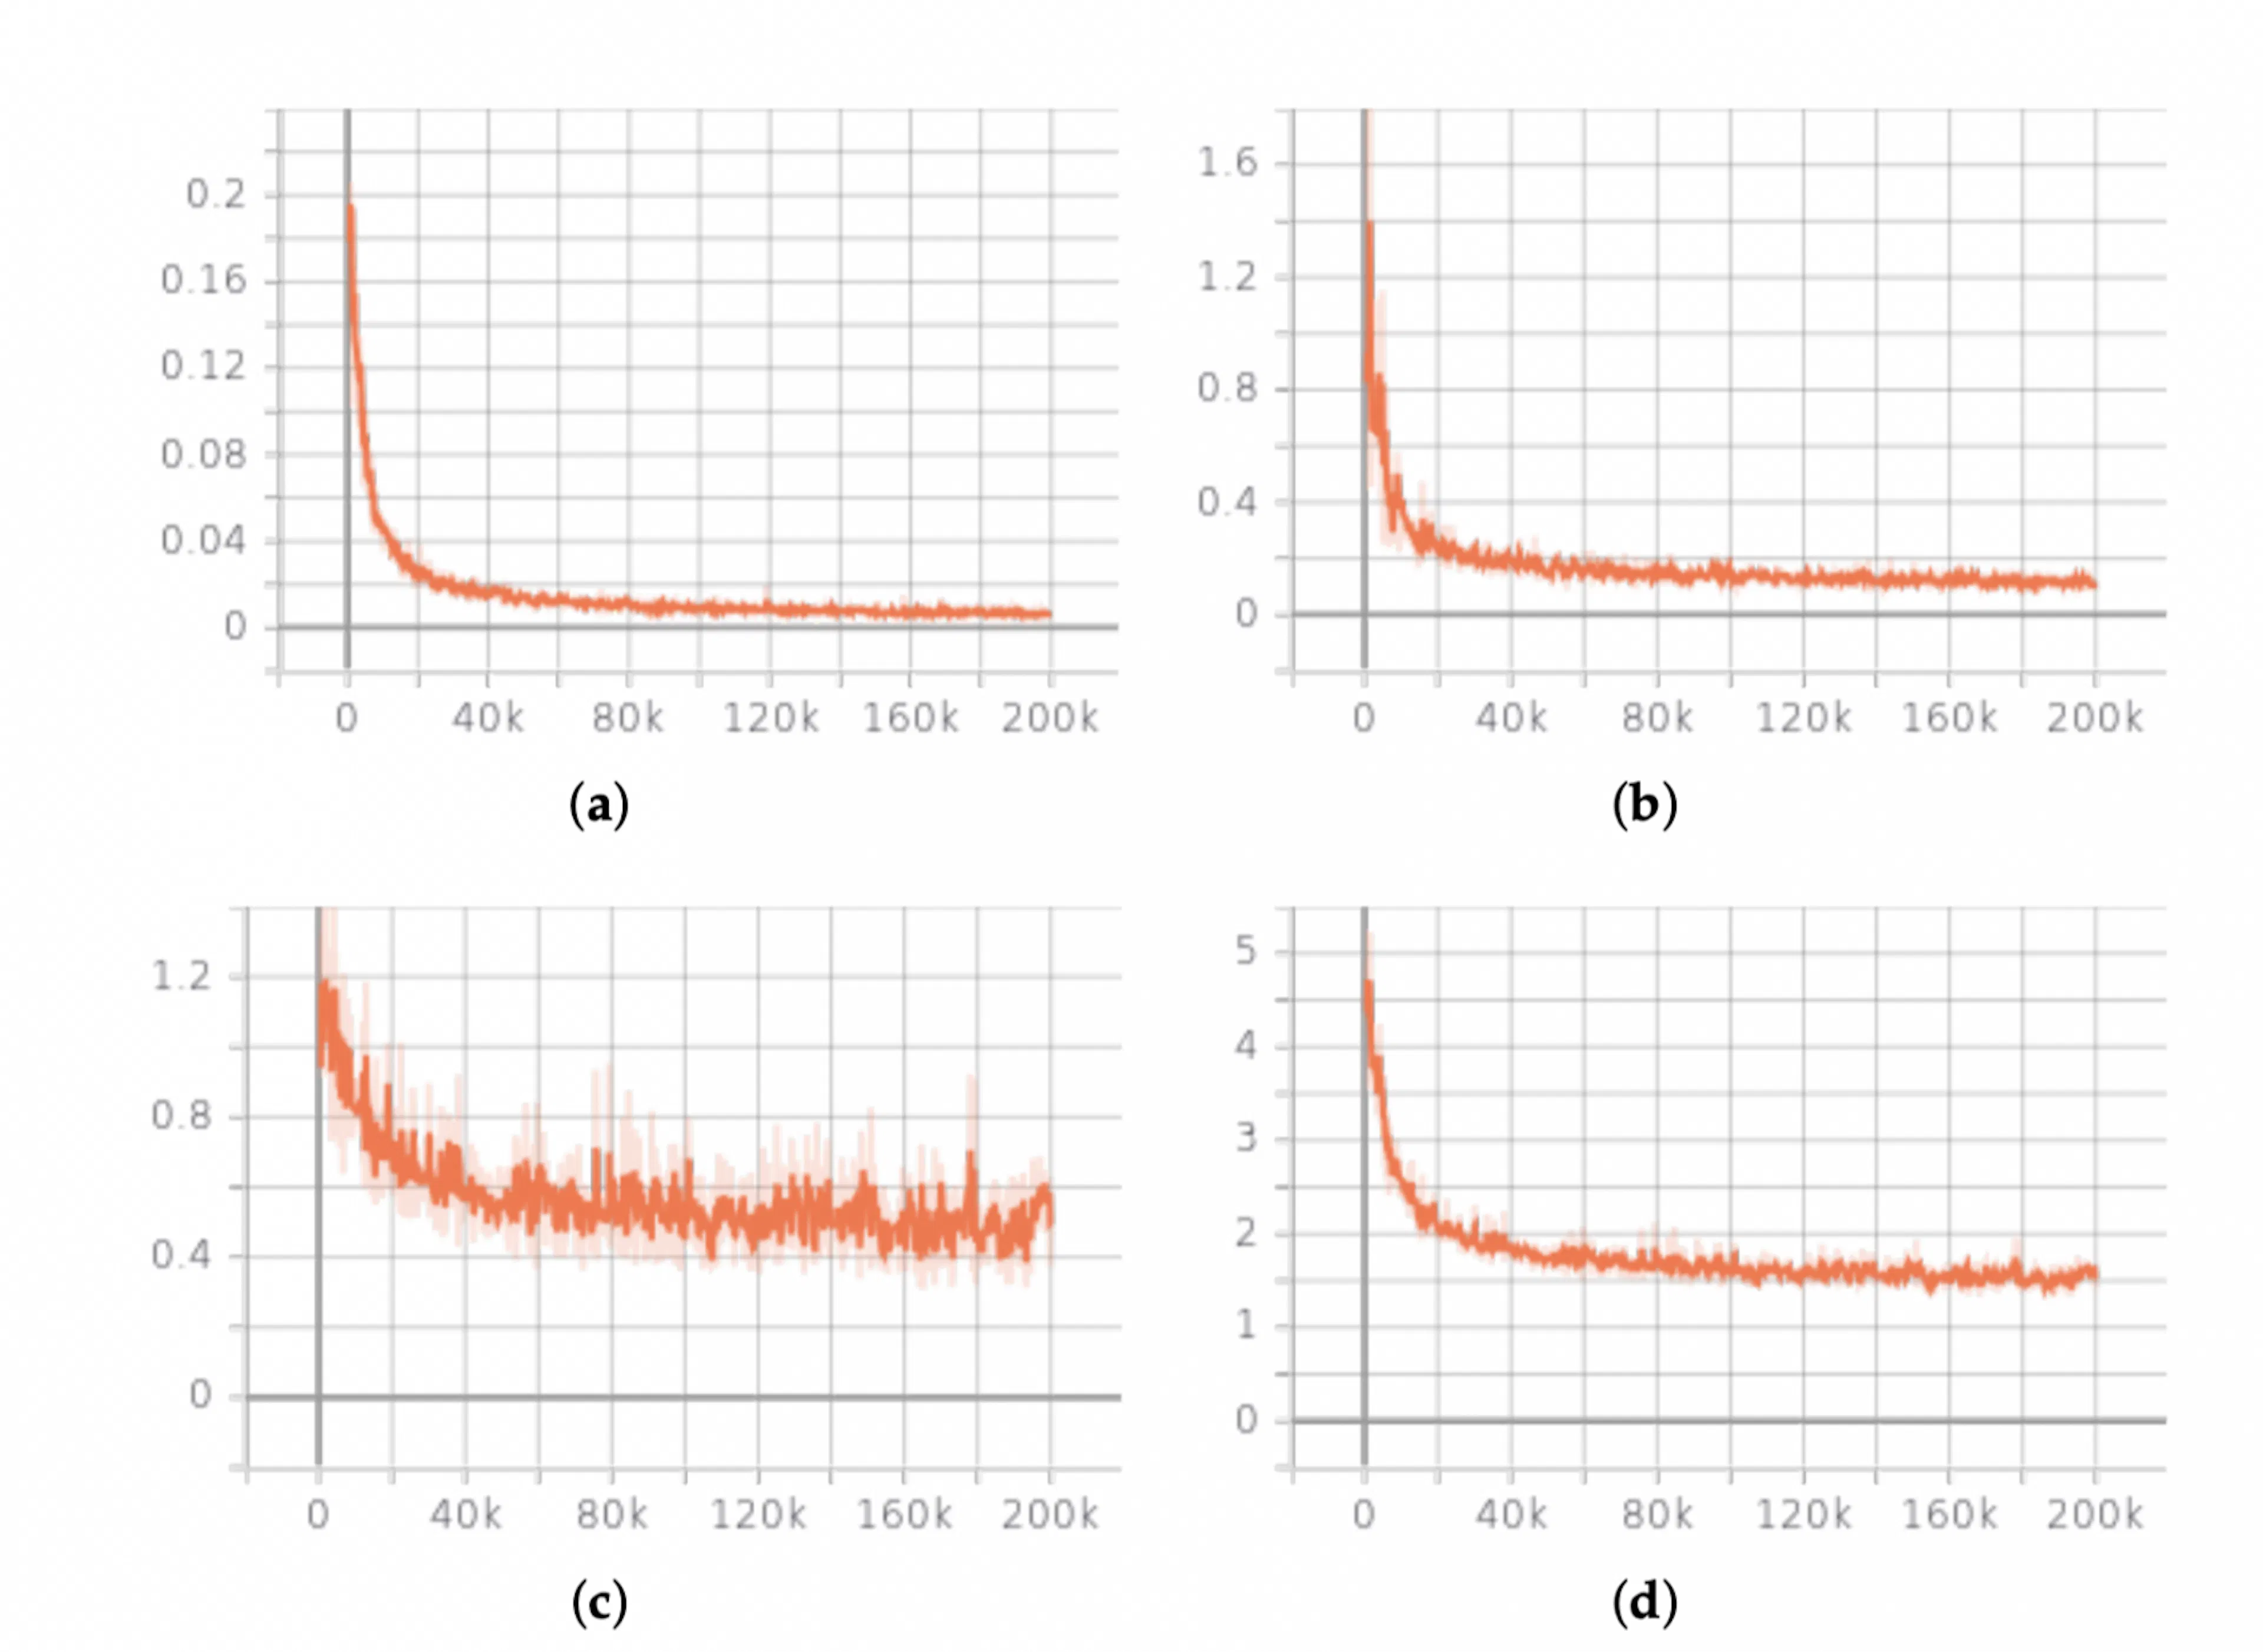 You often come across such graphs. The general downward trend is visible, but there is a rapid plateau. In the (c) graph, you will need to sample checkpoints from the last 50k steps to find the best one with confidence.
Final thoughts
When I started working with Text-to-Speech, I expected a regular ML pipeline with nuances. I was interested in researching the models’ architecture and digging into PyTorch internals. In fact, it turned out that a significant part of the time was spent not on training and building the model, but on trying to answer the question: "Is it really getting better, or do I just think so?"
At some point in TTS, you start to trust your ears more than the metrics.
如有侵权请联系:admin#unsafe.sh