2021-11-11 00:17:56 Author: research.nccgroup.com(查看原文) 阅读量:52 收藏
Written by Ben Lister and Kane Ryans
This blog post details the collaboration between NCC Group’s Detection Engineering team and our Containerisation team in tackling detection engineering for Kubernetes. Additionally, it describes the Detection Engineering team’s more generic methodology around detection engineering for new/emerging technologies and how it was used when developing detections for Kubernetes-based attacks.
Part 1 of this post will offer a background on the basics of Kubernetes for those from Detection Engineering who would like to learn more about K8s, including what logging in Kubernetes looks like and options available for detection engineers in using these logs.
Part 2 of this post offers a background on the basics of Detection Engineering for those from the containerization space who don’t have a background in detection engineering.
Part 3 of this post brings it all together, and is where we’ve made unique contributions. Specifically, it discusses the novel detection rules we have created around how privilege escalation is achieved within a Kubernetes cluster, to better enable security operations teams to monitor security-related events on Kubernetes clusters and thus to help defend them in real-world use.
For those with familiarity with Kubernetes, you may wish to skip forward to our intro to Detection Engineering section here, or to our work on detection engineering for Kubernetes, here
Part 1: Background – Introduction to Kubernetes
Before talking about detections for Kubernetes, we’ll in this section offer a brief overview of What Kubernetes is, its’ main components, and how they work together.
What is Kubernetes?
Kubernetes (commonly stylized as K8s) is an open-source container-orchestration system for automating computer application deployment, scaling, and management. It was originally designed by Google and is now maintained by the Cloud Native Computing Foundation. It aims to provide a "platform for automating deployment, scaling, and operations of Container workloads". It works with a range of container tools and runs containers in a cluster, often with images built using Docker. [1]

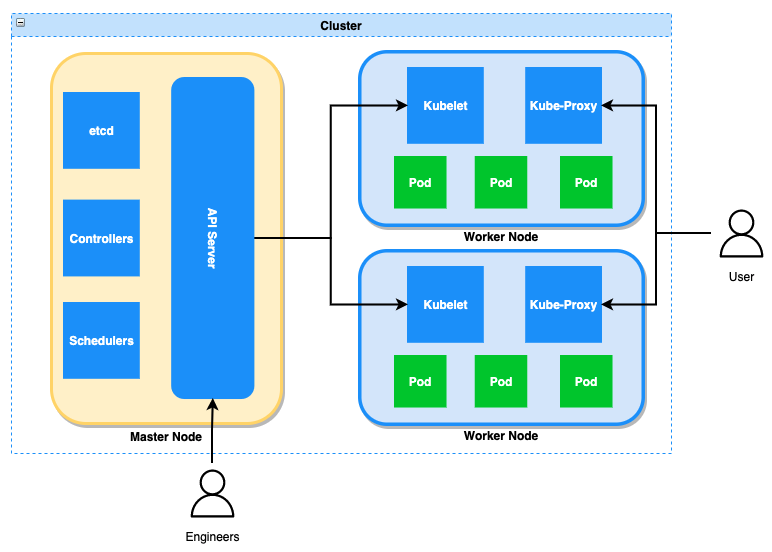
Figure 1: A typical cluster diagram. More information on the components can be found here
At a high level, the cluster can be divided into two segments, the control plane and the worker nodes. The control plane is built up of the components that manage the cluster such as the API server, and it is this control plane where we focused our detection efforts which will be discussed later on.
Whilst we’re discussing the various components of a cluster, it is important to quickly note how authentication and authorization is handled. Kubernetes uses roles to determine if a user or pod is authorized to make a specific connection/call. Roles are scoped to either the entire cluster (ClusterRole) or a particular namespace (Role).
These roles contain lists of resources (the object) the role can grant access to, and a list of verbs that the role can perform on the said resource, are declared and then attached to RoleBindings. RoleBindings pretty much link the role (permissions) with the users and systems. More information on this functionality can be found here in the Kubernetes official documentation.
apiVersion: rbac.authorization.k8s.io/v1
kind: Role
metadata:
  namespace: default
  name: pod-reader
rules:
- apiGroups: [""]
  resources: ["pods"]
  verbs: ["get", "watch", "list"]
Figure 2: Example of a policy configuration taken from the Kubernetes documentation
The above policy is allowing any system or user to retrieve information on pod resources located in the default namespace of the cluster.
Why use Kubernetes?
Kubernetes provides the capability to scale up horizontally as opposed to scaling vertically, i.e., spreading the workload by adding more nodes instead of adding more resources to existing nodes.
Kubernetes is an enticing proposition for many companies because it provides them with the ability to document configurations, disperse applications across multiple servers, and configure auto-scaling based on current demand.
Kubernetes Logging
Detection engineers are only as good as their data. That is why finding reliable and consistent logs is the first problem that needs solving when approaching a new technology for detection engineering.
This problem is made harder as there are multiple ways of hosting Kubernetes environments, such as managed platforms like Azure Kubernetes Service (AKS), Elastic Kubernetes Services (EKS) and Google Kubernetes Services; and natively running Kubernetes as an unmanaged solution.
Ultimately, we decided to utilise API server audit logs. These logs provide a good insight into what is going on inside the cluster, due to the nature of the API server. In normal operation, every request to make a change on the Kubernetes cluster goes through the API server. It is also the only log source consistent among all platforms.
However, there are some issues raised by using these logs. Firstly they need to be enabled, the audit policy detailed here is a good start and is what was used in our testing environments. Some managed platforms will not let you customise the audit logging, but it still needs to be enabled. From a security perspective certain misconfiguration, such as unauthenticated access to Kubelets, would allow an attacker to bypass the API server, making these logs redundant and therefore bypassing all our detections.
It is important to note that audit logs will tell you everything that is happening from an orchestration perspective (pods being deployed, configuration changes, users being added, etc), not what is happening inside the containers which in some cases tends to be where the initial compromise occurs.
An audit policy that is too broad can easily generate a lot of irrelevant events, so testing of the configuration should be conducted to ensure ingestion of these events are within acceptable limits.
{
  "kind": "Event",
  "apiVersion": "audit.k8s.io/v1",
  "level": "Request",
  "auditID": "bd93fded-1f5a-4046-a37c-82d8909b2a80",
  "stage": "ResponseComplete",
  "requestURI": "/api/v1/namespaces/default/pods/nginx-deployment-75ffc6d4d-nt8j4/exec?command=%2Fbin%2Fbash&container=nginx&stdin=true&stdout=true&tty=true",
  "verb": "create",
  "user": {
    "username": "kubernetes-admin",
    "groups": [
      "system:masters",
      "system:authenticated"
    ]
  },
  "sourceIPs": [
    "<removed>"
  ],
  "userAgent": "kubectl/v1.21.2 (darwin/amd64) kubernetes/092fbfb",
  "objectRef": {
    "resource": "pods",
    "namespace": "default",
    "name": "nginx-deployment-75ffc6d4d-nt8j4",
    "apiVersion": "v1",
    "subresource": "exec"
  },
  "responseStatus": {
    "metadata": {},
    "code": 101
  },
  "requestReceivedTimestamp": "2021-10-21T08:39:05.495048Z",
  "stageTimestamp": "2021-10-21T08:39:08.570472Z",
  "annotations": {
    "authorization.k8s.io/decision": "allow",
    "authorization.k8s.io/reason": ""
  }
}
Figure 3: A sample of an audit log
Part 2: Background – Detection Engineering Approach
This next section is to give some background around our approach to detection engineering and is not specific to Kubernetes. If you are just here for the Kubernetes content, feel free to skip it and the rest of the blog will still be understandable.
When approaching a problem, it can be helpful breaking it down to simpler steps. We do this in detection engineering by splitting our detections into categories. These categories allow us to look at the problem through the lens of each category and this helps create a well-balanced strategy that incorporate the different types of detection. There are three distinct categories, and each has its own strengths and weakness, but all contribute to an overall detection strategy. The categories are signatures, behaviours, and anomalies.
Signatures
Signatures are the simplest category. It includes detection that are predominately string matching and using known Indicator of Compromise (IoC). They are simple to create and so can be produced quickly and easily. They are usually very targeted to a single technique or procedure so produce low numbers of false positives and are easy to understand by a SOC analyst. However, they are usually trivial to bypass and should not be relied upon as the sole type of detection. Nonetheless, signatures are the first level of detection and allows for a broad coverage over many techniques.
Behaviours
Behavioural analytics are more robust than signatures. They are based on breaking down a technique to its core foundations and building detections around that. They are usually based on more immutable data sources, ones that can’t be changed without changing the behaviour of the technique itself. While the quality of the detection itself is usually higher, the quality of the alert is comparatively worse than signature-based analytics. They will likely produce more false positives and be harder to understand exactly why any alert is being produced due to the more abstract nature of the analytics and the need for more in-depth understanding of the technique being detected.
Anomalies
Anomaly analytics are any detections where "normal" behaviour is defined and anything outside of normal is alerted on. These kinds of analytics are not necessarily detecting anything malicious, but anything significantly different so that it will be worth further investigation. A single anomaly-based detection can be effective against a wide range of different techniques. However, they can be harder to evaluate performance on compared to signatures and behavioural detections as performance may significantly differ depending on the environment. This can be mitigated somewhat my using techniques that calculate the thresholds based on historical data which means the thresholds are tailored to that environment.
Understanding your advantage
The other concept that is useful when approaching detection engineering is "knowing where we can win". This is the idea that for any given environment/system/technology there will be areas where defenders have a natural advantage. This may be because the logging is better, the attacker is forced into doing something, or there is a limited number of options for an attacker. For example, in a Windows Environment the defender has an advantage when detecting lateral movement. This is because there is twice as much logging (logs can be available on both the source and destination host), there is a smaller number of techniques available compared to other tactics such as execution and an attacker will usually have to move laterally at some point to achieve their goals.
Part 3: Kubernetes Detections
Through our collaboration with NCC Group’s Containerisation team, we identified several use cases that needed detection. The main area on which we decided to focus our efforts was around how privilege escalation is achieved within the cluster. The two main ways this is done is abusing privileges of an existing account or creating a pod to attempt privilege escalation. All our detections are based on events generated by audit logs. For brevity, only a subset of our detections will be described in this blog.
Signatures
The audit logs are a useful source for signature-based detection, since they provide valuable information, such as request URIs, user-agents and image names where applicable. These fields in the data can be matched against lists of known suspicious and malicious strings. These lists can then be easily updated, for example, adding new signatures and removing older signatures based on their effectiveness.
Interactive Command Execution in RequestURI
For certain requests the requestURI field within an audit log contains the command being executed, and the namespace and pod the command is being applied to. This can be used to identify when a command shell is being used and may indicate further suspicious behaviour if unauthorized.
The table contains some of the shell examples of signatures that can be used to detect this type of behaviour in the requestURI field. A full example of how this might look in an audit log can be seen in figure 3 earlier in the blog. Some example of signature that are useful t search for are:
- %2Fbin%2Fbash
- %2Fbin%2Fsh
- %2Fbin%2Fash
User-Agent
The user-agent is a HTTP header that provides meta information on the kind of operating system and application that is performing the request. In some cases, it can also be used to identify certain tooling making requests.
One example of using this field for signature-based detection is looking for User-Agents containing "access_matrix". Any occurrences of this would signify an access review tool is being used called Rakkess. This tool is a kubectl plugin and would be expected within say something like a dev or staging cluster. When the use is unexpected this may be indicative of an attacker performing post compromise actions.
"userAgent": "kubectl-access_matrix/v0.0.0 (darwin/amd64) kubernetes/$Format"Another example might be the use of cURL or HTTP request libraries that may indicate post-exploit actions, especially when not been previously seen in the environment. Important to note that the user-agent can be modified by the source, so it is trivial to bypass this type of detection.
Image
This field includes the image name to be deployed and the registry from which it came. These tools all have legitimate use cases but any unauthorized use of them on a Kubernetes cluster would need alerting on and further investigation.
Some examples of such images include but aren’t limited to.
- cyberark/kubiscan
- aquasec/kube–hunter
- cloudsecguy/kubestriker
- corneliusweig/rakkess
The image field could also be utilised to detect when pods are being deployed for crypto-mining purposes. Running crypto miners after compromising a cluster is a commonly seen tactic and any known crypto mining images should also be added as a signature for known bad container images.
Behaviours
Anonymous User Logon
With any system a user performing actions without authenticating is usually a bad thing. Kubernetes is no different and there have been some high-profile incidents where the initial access was an API Server exposed to the internet which allowed unauthenticated access. The first line of defence would be to mitigate the attack by disabling unauthenticated access. This can be done with the –anonymous-auth=false flag when starting a kubelet or API server.
As an additional layer of defence, any request to the API server where the user field is system:anonymous or system:unauthenticated should also be alerted on.
Service Account Compromise
Kubernetes pods run under the context of a service account. Service accounts are a type of user account created by Kubernetes and used by the Kubernetes systems. They differ from standard user account in that they are prefixed with “serviceaccount” and usually follow well-defined behaviours. To authenticate as a service account, every pod stores a bearer token in /var/run/secrets/kubernetes.io/serviceaccount/token, which allows the pod to make requests to the API server. However, if the pod is compromised by an adversary, they will have access to this token and will be able to authenticate as the service account, potentially leading to an escalation of privileges.
Detecting this type of compromise can be difficult as we won’t necessarily be able to differentiate between normal service account usage and the attacker using the account. However, the advantage we have is that service accounts have well-defined behaviour. A service account should never send a request to the API server that it isn’t authorised to do. Additionally, a service account should never have to check the permissions it has. Both actions are more indicative of a human using the service account rather than the system. Therefore, any requests where the user starts with “serviceaccount” that is denied or the resource field contains “selfsubjectaccessreview” should be alerted on.
Other Notable Behaviours
The major behaviour we have not gone into detail in this post is how Kubernetes handles Role-Based Access Control (RBAC). RBAC is a complex topic in Kubernetes and warrants its own blog post to go into all the different ways it can be abused. However, in any system it is worth alerting on high privilege permissions being assigned to users and this should be handled in any Kubernetes detections as well.
A ‘short lived disposable container’ is another behaviour that can indicate malicious behaviour. Shell access to containers configured with tty set to true, and a restart policy set to never are highly suspicious on an operational cluster. It’s unlikely there is a genuine need for this, and it could indicate an attacker trying to cover up their tracks.
Finally, the source IP is present in all audit log events. Any request outside of expected IP ranges should be alerted on, particularly for public IP ranges as this may indicate that the API server has been accidentally exposed to the internet.
Anomalies
One of the questions we asked ourselves was “How do we know when a pod has been created for malicious purposes?”. There are multiples ways a pod could be configured that would allow some form of privilege escalation. However, each of these configurations have a legitimate use case and it is only when they are used in a way that deviates from normal behaviour that they become suspicious.
In order to create detections for this the following assumption was made; pods created by a single company will following similar patterns in their configuration and deviations from these patterns would include pods that are suspicious and would be worthwhile putting in front of an analyst to investigate further.
Anomaly detection by Clustering
To do this we used a technique called clustering. This blog will not go into many details of exactly how the clustering works, some SIEMs such as Splunk have built in functions to allow this kind of processing to be done with minimal effort. Clustering involves taking multiple features of an object, in this case the configurations of the pod, and grouping the objects so that the objects with similar features are in the same group. The easiest way of describing clustering and how we can find anomalies is through visualising it.

The diagram shows a set of objects that are split into clusters based on their 2 features. It’s trivial to see 2 large groups of points, cluster 1 and cluster 2, that have been grouped based on feature similarity. The assumption would be that any object in these clusters are normal. The anomaly is the red triangle, since its features do not follow the pattern of the other objects and therefore would be worth further investigation.
Feature Extraction
The important part is choosing the right features to cluster on. We want to identify features of pod creation that remain consistent during normal activity (e.g., the user creating the pod and the registry of the container image) since changes in these would indicate suspicious behaviour. Also, we want to identify settings that could allow some form of privilege escalation, changes in these settings could indicate a malicious pod being created. For this we consulted our internal containerisation team and the list of the features decided upon can be found in the table below. Also included is the json path to find these field in the audit log.
| Feature | Description | JSON path in audit log |
|---|---|---|
| Image Registry | Registry the container image is stored. Effective when using a custom container registry | requestObject.spec.container.image |
| User | User sending the request. Effective when a subset of users create pods | user.username |
| Privilege Container | When enabled, privileged containers have access to all devices on the host | requestObject.spec.container.securityContext.privileged |
| Mounted Volumes | Indicates which directories on the host the container has access to. Mounting /host gives access to all files on host | requestObject.spec.container.volumeMounts.mountPaths |
| HostNetwork | When enabled container has access to any service running on localhost on the host | requestObject.spec.container.HostNetwork |
| HostIPC | When enabled container share IPC namespace. Allows inter-process communication with process on host | requestObject.spec.container.HostIPC |
| HostPID | When enabled containers share the PID namespace on the host. Allows for process listing of the host | requestObject.spec.container.HostPID |
Bringing it all together
Splunk contains a cluster command which is perfect for this use case. By creating a single string of the features delimited by a character of our choice, we can assign all pod creation events to a cluster. The exact time period to run the command over is subject to a trade-off between performance of the detection and performance of the query. The longer the lookback, the less chance of false positives, but the longer the time the query takes to run. After some trial and error, we found 14 days was a good middle ground but could be increased up to 30 days for smaller environments.
Once the cluster command has run, we can look for any events assigned to a cluster where the overall size of the cluster is relatively small. These will be events that are sufficiently different from the rest that we will want to flag them as suspicious and have an analyst investigate further.
Conclusions
So to wrap things up, the use of Kubernetes is increasing so therefore detection engineering of this technology becomes an important problem to tackle. Kubernetes Audit logs allow us to tackle this as they are a great source of events within the Kubernetes cluster and importantly are consistent across all platforms that run a Kubernetes cluster. A good detection engineering strategy has multiple layers and includes a variety of detections based on signatures, behaviours, and anomalies. In particular for Kubernetes, we want to be focusing our efforts on abuse of privileges and the creation of pods. There are multiple approaches to doing this, a few of which we have introduced in this post.
如有侵权请联系:admin#unsafe.sh